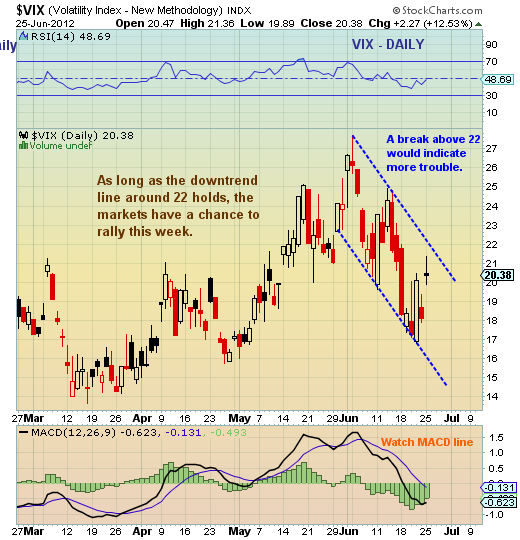
![]() The Volatility Index (VIX) closed out the holiday week on its own holiday. With the markets down all day, the VIX defied logic and drifted lower (note the VIX typically moves in opposition to market direction).
The Volatility Index (VIX) closed out the holiday week on its own holiday. With the markets down all day, the VIX defied logic and drifted lower (note the VIX typically moves in opposition to market direction).
As long as the VIX is confined within its near-term downtrend channel, the market indices should be okay. However, if the volatility returns and the VIX breaks out above the descending trend line, then the markets will be in trouble. Chart link here.

Volatility Index (VIX) daily chart with support and resistance and technical analysis as of July 6, 2012. VIX channel. Volatility Index ticker is VIX.
———————————————————
Twitter: @andrewnyquist and @seeitmarket Facebook: See It Market
No position in any of the securities mentioned at the time of publication.
Any opinions expressed herein are solely those of the author, and do not in any way represent the views or opinions of his employer or any other person or entity.
: Where’s the Deflation in This?")


: Where’s the Deflation in This?")