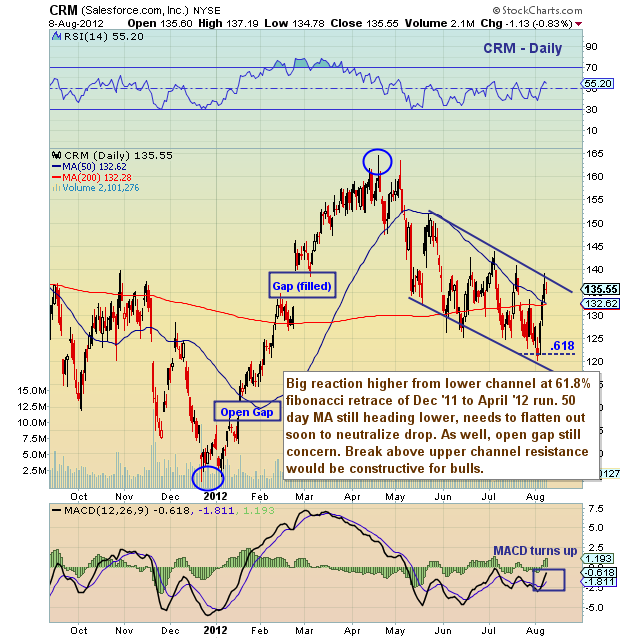
 After a big 60% run from December to April, Salesforce (CRM) sold off hard with the market, before developing a descending channel and stair stepping lower into early August. After hitting the .618 fibonacci retracement level, CRM bounced hard (15 percent in the past week).
CRM is now back at the top of the channel and could use a breather to consolidate gains. Concerns to watch include: falling 50 day MA, lower open gap, and overhead resistance.
Salesforce (CRM) stock chart with technical analysis overlay as of August 8, 2012. CRM stock chart with technical analysis and price support and resistance levels. CRM .618 fibonacci support level.
———————————————————
Twitter: @andrewnyquist and @seeitmarket Facebook: See It Market
No position in any of the securities mentioned at the time of publication.
Any opinions expressed herein are solely those of the author, and do not in any way represent the views or opinions of his employer or any other person or entity.


