 The Hang Seng rallied hard into August and is now consolidating into what bulls hope is a bullish flag formation. Tonight’s session (not reflected in the chart) has the Hang Seng back over 20,000. This is good for bulls, as the index was looking heavy and in danger of rolling over. Any move below 19,750 ushers in caution.
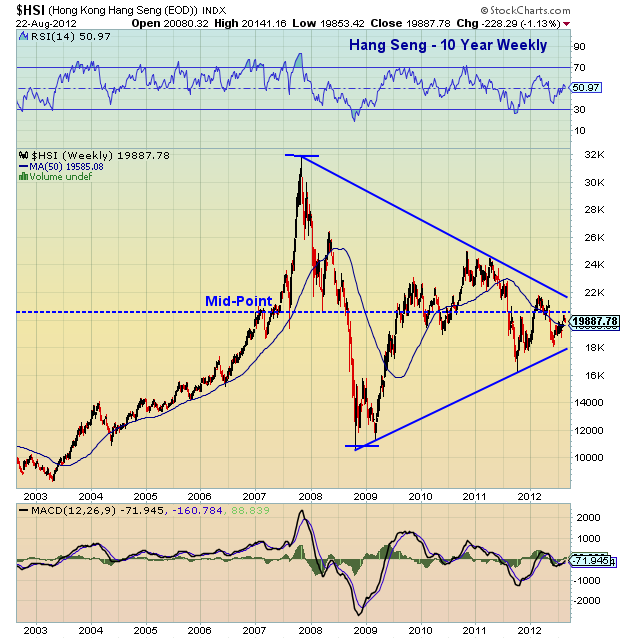
On a long term basis, the Hang Seng is in a narrowing wedge that should break up or down over the coming year (see 10 year chart below). This bears watching.
More charts found here.
Hong Kong Hang Seng stock market charts as of August 22, 2012. Hang Seng charts with trend lines and technical support levels. Hong Kong stock market. Hang Seng technical analysis.
———————————————————
Twitter: @andrewnyquist and @seeitmarket Facebook: See It Market
No position in any of the securities mentioned at the time of publication.
Any opinions expressed herein are solely those of the author, and do not in any way represent the views or opinions of his employer or any other person or entity.


