 This past week was important for Gold and Silver investors. After breaking out above multi-week downtrend lines, both precious metals saw strong follow through (i.e. demand). This is exactly what technicians like to see following a clean price breakout. But much of this breakout analysis is short-term and it’s good to also zoom out and take in the big picture. So let’s look at the silver and gold breakouts on the daily and weekly charts.
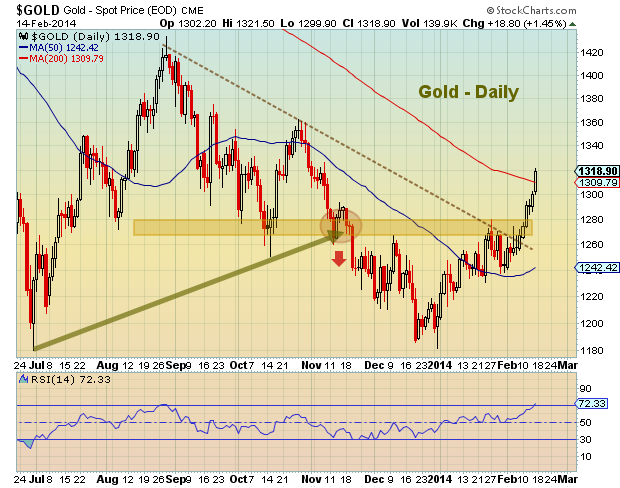
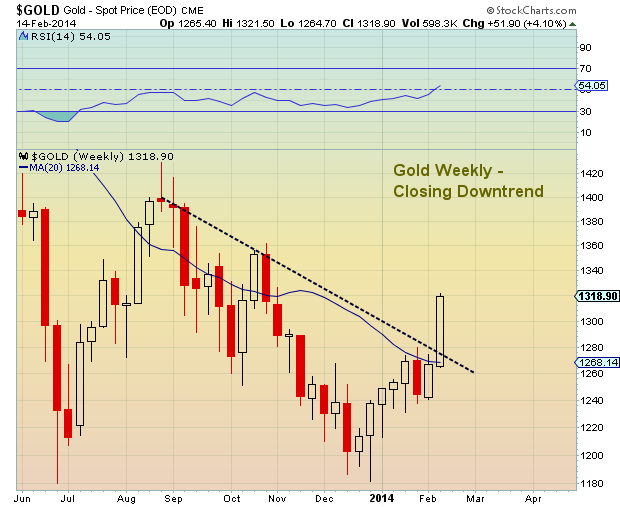
Below are near-term daily and weekly charts for Gold. Both charts highlight the clean price breakout above the $1275 resistance area. I expect some consolidation to occur over the coming days (daily RSI at 72), but momentum looks strong and the bulls are now in control. $1335 is the .618 fib “up” resistance level (of August highs to December lows). A move above this level will likely bring $1400 and a retest of the August 2013 highs.
Gold Breakout Chart – Daily
 Gold Breakout Chart – Weekly
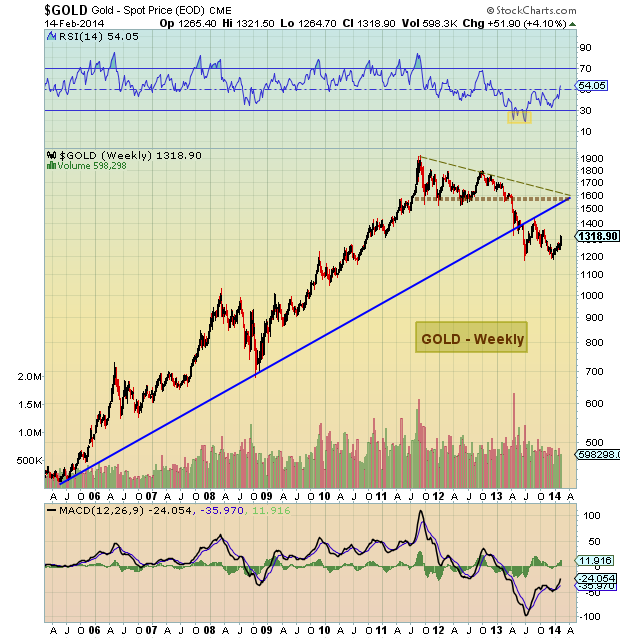
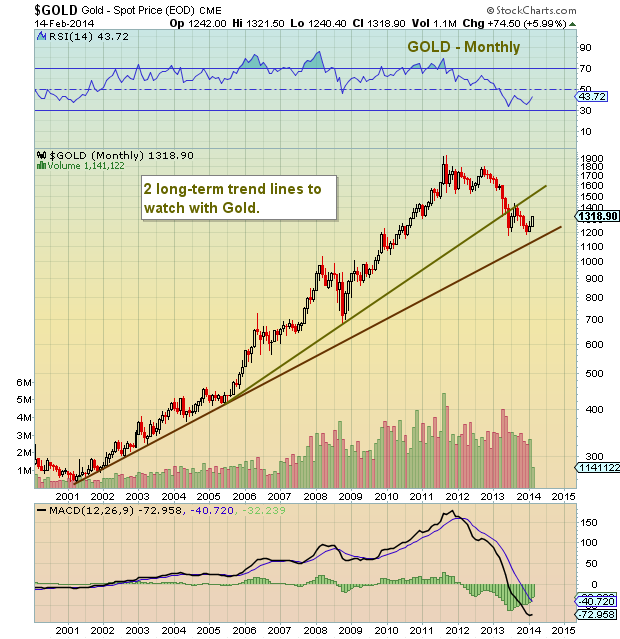
 Taking another step back on the weekly chart, it’s easy to see the breakdown below the 7-year uptrend line. Should the rally push gold prices back above the $1450 level, then a backtest of this broken uptrend line could be in the cards; this area also coincides with the waterfall breakdown area around $1525. Note that the weekly chart is not overbought. Also shown below is the monthly chart with two key trend lines.
Gold Price Chart – Weekly (long-term)
 Gold Price Chart – Monthly (long-term)
Silver’s move higher was in lock step with the gold breakout, but perhaps a bit more powerful setup. The recent bottom in Silver prices came during a two month basing pattern. This kind of price action allowed Silver to build up enough energy for a powerful breakout higher last week. Technical resistance could come into play around the $23.00-$23.50 area, and again at the August 2013 highs around $25.00. A move above that area would bring $27.00-$27.50 into play.


: Showing Some Signs of Emerging Strength")
