The last time I blogged about banks stocks and the Financial Sector ETF (NYSEARCA:XLF) was in July 2016. At the time, we noted a reason for immediate resistance… but ultimately a very well defined triangle pattern warned of an impending breakout to the upside.
It’s time for an update with a potential XLF price target.
My analysis has been wrong on an A-B-C correction which originally identified the 24 area as a main area of price resistance. Like everything these days, this pattern has been defeated.
How far will XLF run?
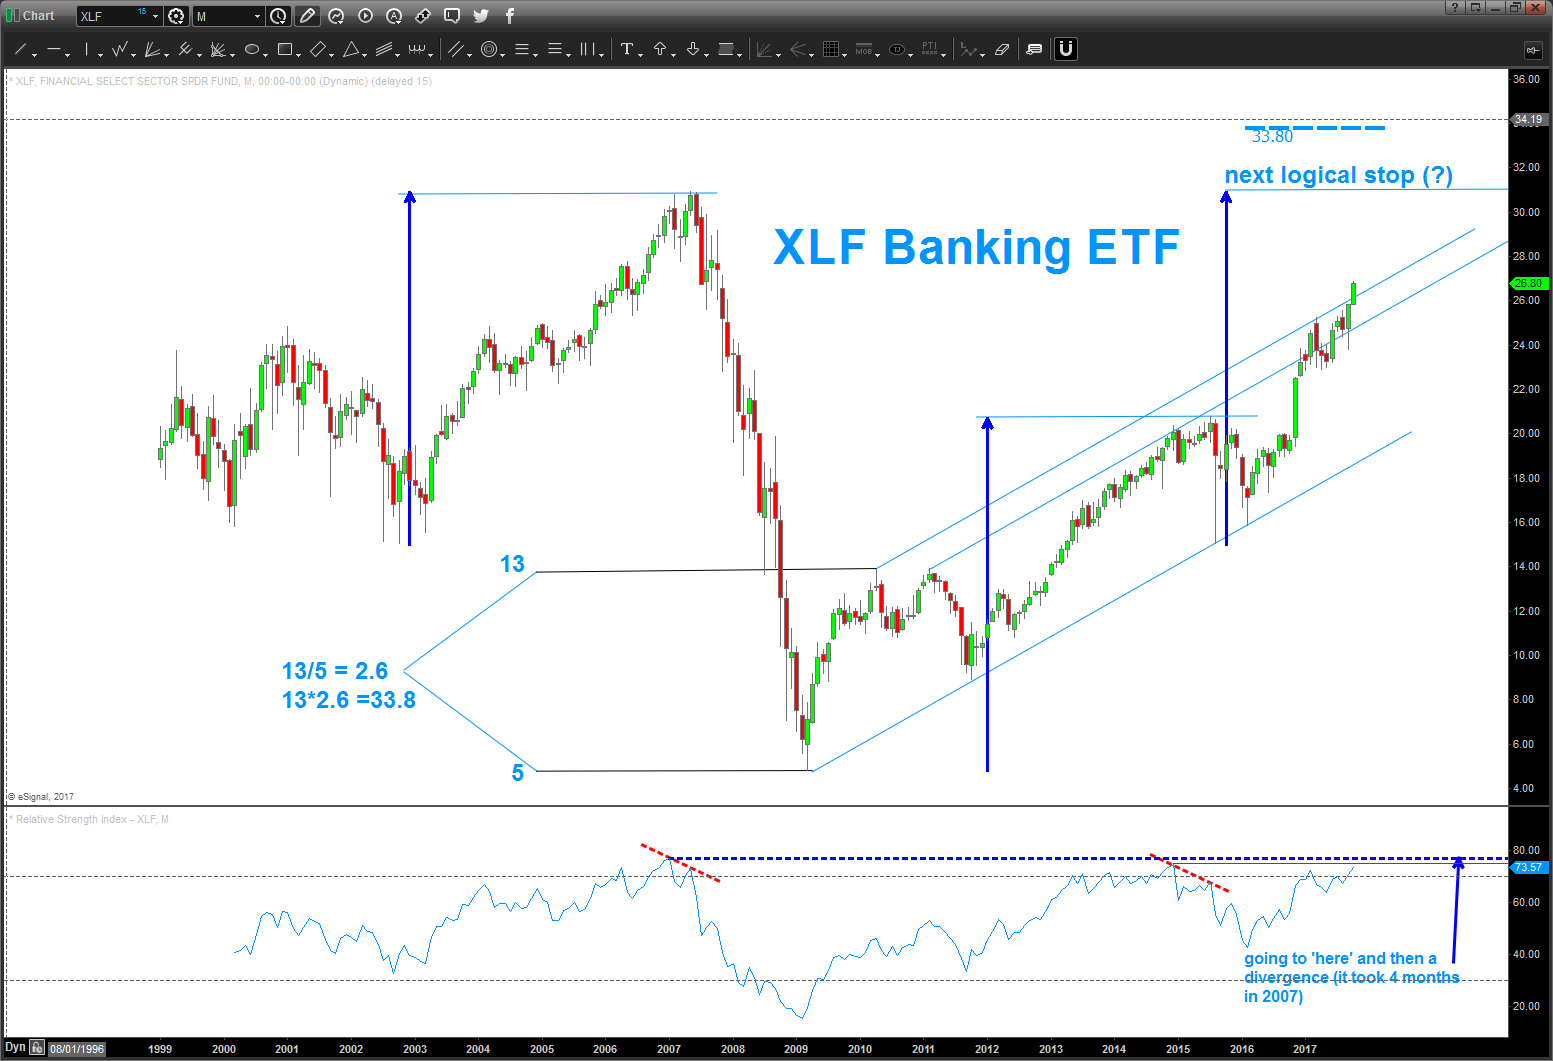
This month the Financial ETF (XLF) broke out above the upper part of the defined channel that was holding bank stocks at bay.
Using measured moves and the fundamental frequency price target technique taught to me by Michael Jenkins, it appears that the all time highs on the XLF (or even higher) will be attacked in the coming months.
The Banks lead the stock market UP and they lead us DOWN. Right now, there’s no sign of them heading lower (in earnest) anytime soon.
Will monitor closely in the coming months… Thanks for reading.
Twitter: @BartsCharts
Author does not have a position in mentioned securities at the time of publication. Any opinions expressed herein are solely those of the author, and do not in any way represent the views or opinions of any other person or entity.


