SPDR Health Care Select Sector ETF Chart – NYSEARCA: XLV
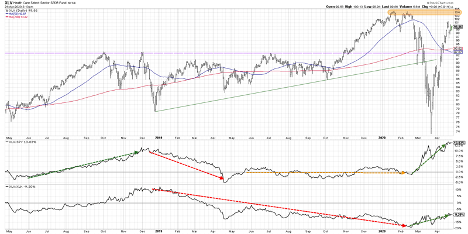
The One Chart for today is the chart of the Health Care Sector ETF (XLV).
This chart is interesting first and foremost because it is a sector that has been remarkably resilient.
If you look at the second panel down, you’ll see the ratio of Health Care vs the S&P 500, or the broader equity space in the US. For the 2nd half of 2019, and really into the first month and a half of 2020 up until the market peak, Health Care had short-term periods of underperformance and outperformance.
Overall it was a market performer, after being a big underperformer in the first half of 2019 coming out of the December 2018 market lows.
However, you’ll notice in mid-February as the market sold off, Health Care started to improve and became a “safe haven” of sorts as the market was selling off. The XLV pulled back a little on a relative basis going into the low the 3rd week in March, but since then, it has continued on to new relative highs.
During the sell-off and now during the recovery, Health Care has had the most V bottoms out of all the V bottoms out there. It’s fair to say that Health Care has now become more of a bellwether. It has performed well as offense and as defense, meaning it has performed well in both bullish and bearish cycles over the last couple of months.
Another point to note about this chart is that it’s approaching key resistance. One of the challenges that the overall market will need to overcome is to see a key sector like Health Care not only reach its previous resistance levels, but break through them.
Many sectors topped out in February and the market had a higher peak in February as well, but Health Care had its ultimate high in January of this year. In order to validate some sort of recovery, we would need to see the XLV eclipse that high from mid-January and close above $105.
While this is possible, it’s highly unlikely based on the breadth readings, lighter volume, and the fact that the overall market is right at that range where you’d expect an end to a bear market rally. It would be really tough to see the XLV go above that $105 level, but that’s why it’s an important chart to watch.
Finally, the bottom panel highlights the ratio of Health Care vs Technology. If you look from the market bottom at the end of 2018, Health Care was underperforming Technology and the trend overall had been negative. It was much better to own big Tech names than big Health Care names.
But now look at how that has changed. The relative strength of Technology has actually come off a little bit, and even though a lot of Tech charts are still holding up well like Apple and Microsoft, Health Care has emerged as a better opportunity relatively speaking.
We’re potentially seeing a change of leadership away from the Technology sector, especially away from some of the mega-cap Tech names, and toward Health Care. And it’s not just the Biotechs. There are really good charts across the industries within Health Care, including Big Pharma and Medical Supplies.
The XLV is a compelling chart for three reasons. Its resilience on a relative basis in both bullish and bearish cycles these last few months is impressive. It is approaching a key resistance level, a breakthrough of which could point toward a market recovery. And it has outperformed Technology. With a lot of people assuming Tech is the strength within equities, Health Care is showing there are alternatives out there.
To watch this in video format, just head over to my YouTube channel!
Twitter: @DKellerCMT
The author does not have a position in mentioned securities at the time of publication. Any opinions expressed herein are solely those of the author, and do not in any way represent the views or opinions of any other person or entity.
")


")
