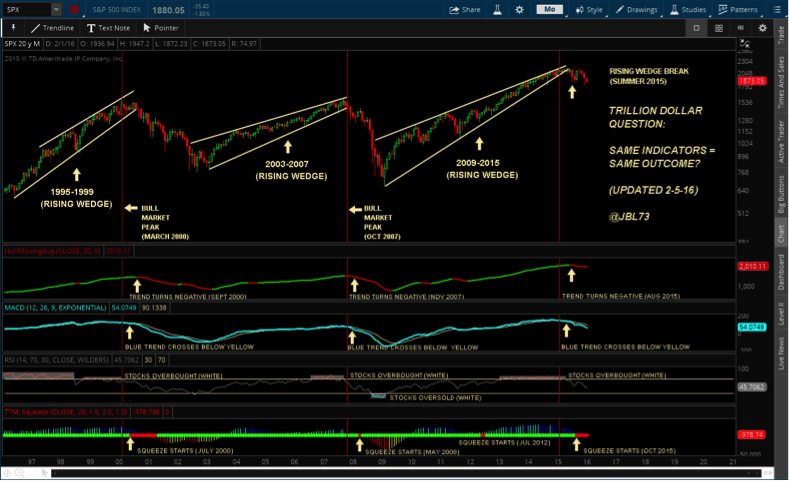
And, of course I am watching the S&P 500 on monthly timeframe in the Trillion Dollar Question, first published in April 2015, and updated frequently. Notice, I have included the Bollinger squeeze indicator at bottom that started in October 2015 (think of it as a buildup of energy in red, to be released in direction of Trend in green).
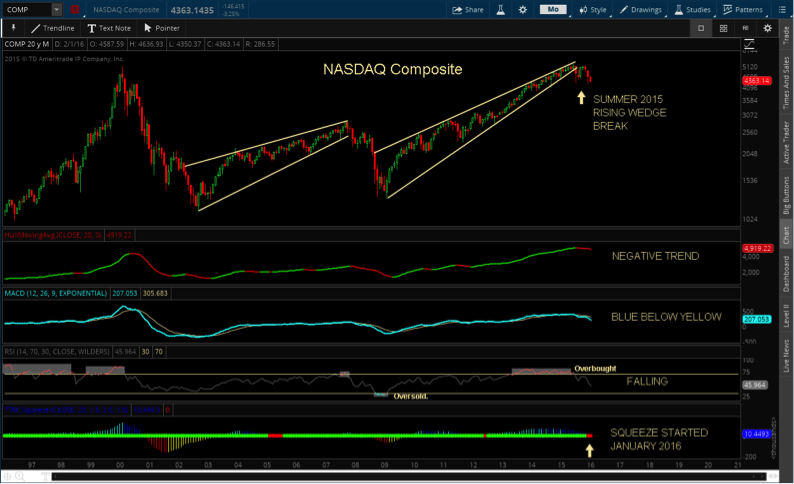
The second chart shows the NASDAQ Composite started a squeeze in January 2016.
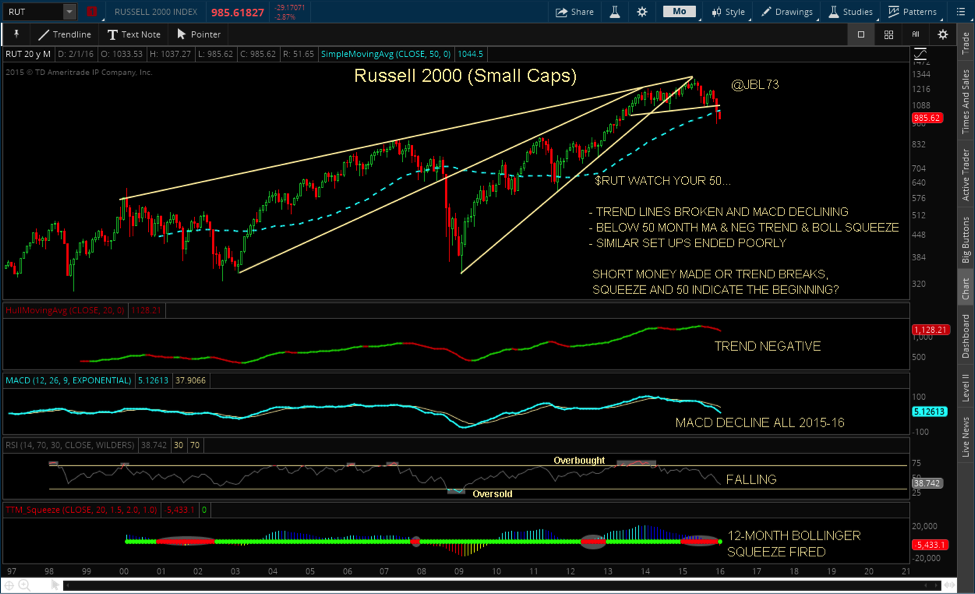
The third chart shows the Russell 2000 had a squeeze build up all of 2015, and this month is experiencing a squeeze release – down. See a pattern? Not sure even the central banks can stop these emerging price patterns. Stay tuned.
Other Charts And Considerations
The Trillion Dollar Question
Nasdaq Composite
Russell 2000
JBL Wealth’s TREND and MOMENTUM strategies are tactical, programmed ahead of time, and have been reacting, signaling cautious portfolio allocations since Spring 2015. Moreover, they have been signaling the most conservative positions since 2009 as of mid-summer 2015. As conditions change and the models react, then client portfolios will be adjusted accordingly. That is, if the August/September & December/January corrections are indeed just a brief break and conditions improve, TREND and MOMENTUM will recognize and adjust accordingly.
Thanks for reading.
Disclaimer from the author:
JBL WEALTH ADVISORY IS A REGISTERED INVESTMENT ADVISER. INFORMATION PRESENTED IS FOR EDUCATONAL PURPOSES ONLY AND DOES NOT INTEND TO MAKE AN OFFER OR SOLICITATION FOR THE SALE OR PURCHASE OF ANY SPECIFIC SECURITIES, INVESTMENTS, OR INVESTMENT STRATEGIES. INVESTMENTS INVOLVE RISK AND UNLESS OTHERWISE STATED, ARE NOT GUARANTEED. BE SURE TO FIRSTCONSULT WITH A QUALIFIED FINANCIAL ADVISER AND/OR TAX PROFESSIONAL BEFORE IMPLEMENTING ANY STRATEGY DISCUSSED HEREIN. OPTIONS STRATEGIES ENTAIL DIFFERENT FORMS OF RISK. COVERED CALL WRITING MAY LIMIT THE UPSIDE POTENTIAL OF OUTRIGHT OWNERSHIP OF A SECURITY IN A GENERALLY RISING MARKET. SELLING PUTS COULD REQUIRE AN INVESTOR TO PURCHASE A STOCK AT A MUCH HIGHER PRICE THAN THE PREVAILING PRICE OF THE STOCK IN A MARKET SELLOFF. EXAMPLES PRESENTED ASSUME THE ABILITY TO CONSISTENTLY SELL OPTIONS AT A SPECIFIC PREMIUM AND MAINTAIN OWNERSHIP OF THE STOCK IN A COVERED CALL SCENARIO OR NOT HAVE TO PURCHASE STOCK IN A CASH SECURED SELL PUT SCENARIO. ALL RETURNS ARE NET OF MANAGEMENT FEES.
Past performance of Trend and Momentum models does not predict future performance. All returns shown are with dividends and distributions reinvested. Any benchmark chosen may or may not reflect the same markets or volatility of the back tested portfolio designed and may just be a representative benchmark of a large capitalized stock index. Index returns include dividend reinvestment. Graphs in and of themselves are not predictors of future price movements. All returns shown are net returns and reflect the deduction of the management fees of JBL Wealth Advisory. Back tested modeling has inherent limitations as models do not represent the results of actual trading using client assets but results are achieved by the use of a retroactive application of a back tested model that was designed with the benefit of hindsight. The results do not represent the returns that any investor achieved. Back testing allows the security selection methodology to be adjusted until past returns are maximized. Actual client performance may differ significantly from back tested performance.
Twitter: @JBL73
Any opinions expressed herein are solely those of the author, and do not in any way represent the views or opinions of any other person or entity.

 Testing Important Price Support")
: Cup (and Maybe Handle) Watch")

