The Dow Jones Industrial Average fell nearly 40 percent during the March market crash.
But it seemed to recover from a familiar technical price level.
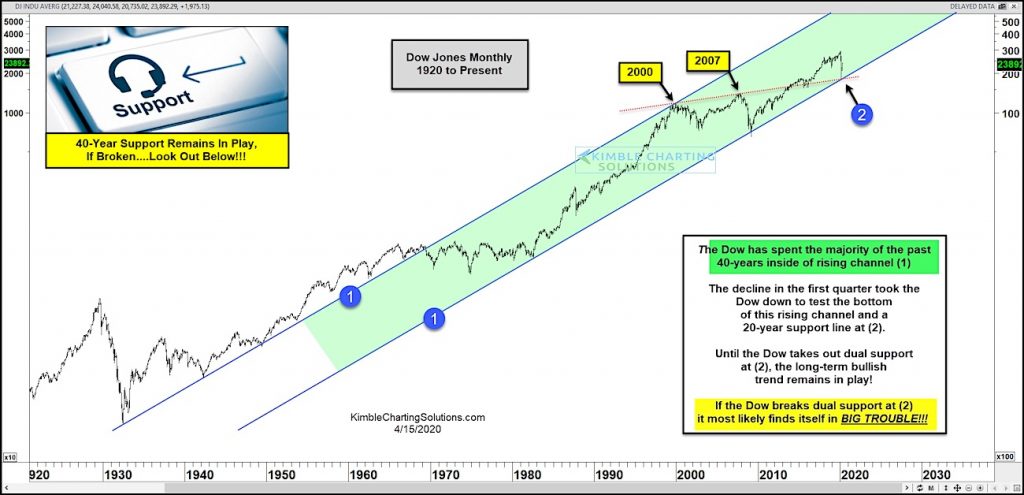
In today’s chart, we highlight a key confluence of support where the Dow Industrials reversed higher off of… and why it need to hold.
The March low took place right at the lower edge of the 40 year up-trend support channel, formed by each (1).
This support level was fortified by another trend line that is marked by the 2000 and 2007 market tops at (2).
Needless to say, the bulls need this support to continue to hold. If not, selling could accelerate on this important global index. Stay tuned!
Dow Jones Industrial Average Chart
Note that KimbleCharting is offering a 2 week Free trial to See It Market readers. Just send me an email to services@kimblechartingsolutions.com for details to get set up.
Twitter: @KimbleCharting
Any opinions expressed herein are solely those of the author, and do not in any way represent the views or opinions of any other person or entity.


: Showing Some Signs of Emerging Strength")
