Today we once again share a long-term view of the S&P 500 Index INDEXSP: .INX.
And we continue to think this should remain on investors’ radars.
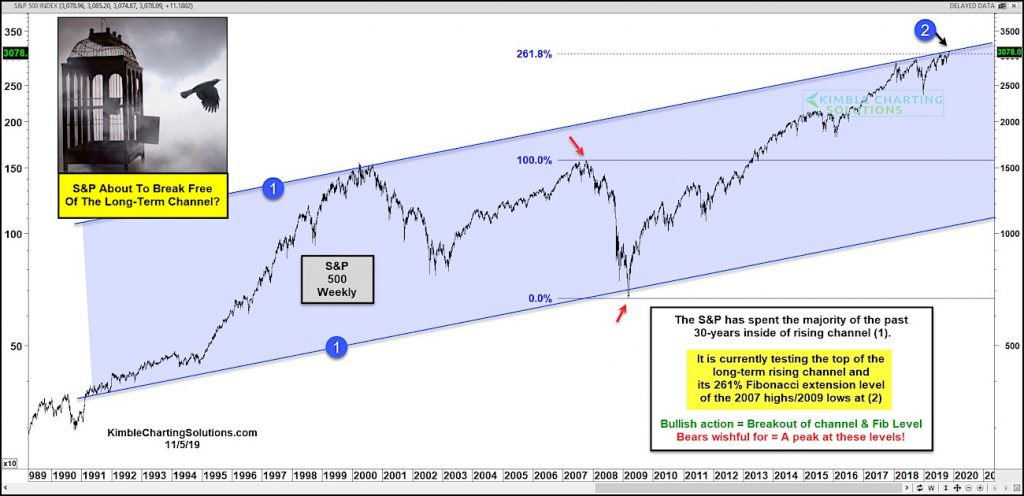
The long-term chart below highlights the 30-year price channel that the S&P 500 Index has traded in. Currently price is testing the upper end of this rising channel at (2).
And it’s been grinding near this rising resistance for the better part of the past 2 years.
So will it breakout and break free from this long-term channel? Or is it destined to sell off and remain in the channel.
Note that the upper end of this price channel also coincides with the 261.8 Fibonacci resistance level / target. So what happens here is likely important. Stay tuned!
S&P 500 Chart
Note that KimbleCharting is offering a 2 week Free trial to See It Market readers. Just send me an email to services@kimblechartingsolutions.com for details to get set up.
Twitter: @KimbleCharting
Any opinions expressed herein are solely those of the author, and do not in any way represent the views or opinions of any other person or entity.

: Showing Some Signs of Emerging Strength")
