When analyzing this week’s gap higher (ad selling), investors need to take into account the week of the election, and price range that formed two weeks ago.
Created from Monday, November 2nd to Friday, November 6th, the high and low from this period creates a range that allows us to see a bullish or bearish bias.
Trading over the range for bullish bias and under for a bearish bias.
Price action inside the range would create a neutral/cautious bias making it safer to use the high and low of the range as support or resistance levels.
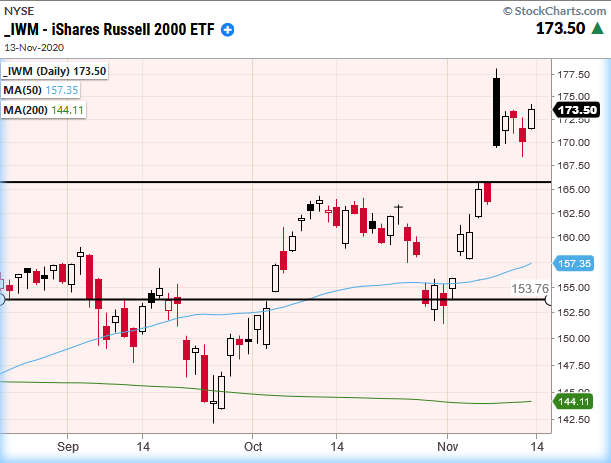
Looking at a daily chart of the Russell 2000 ETF (IWM) shows that the top of the range is at 165.71.
Monday’s large gap up brought us over the election range, and though it has sold off from Monday’s highs, it held that gap all week.
As this past week progressed, IWM traded within the trading range it set on Monday, which supports normal digestion for such a large initial move up.
Of the 4 major indices the only one that isn’t above its election range is the Nasdaq 100 ETF (QQQ).
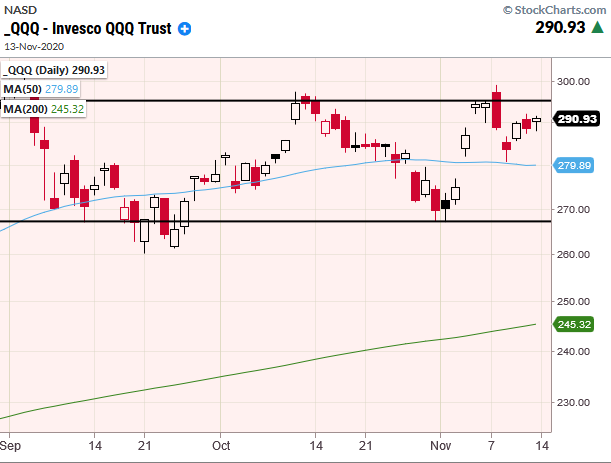
Above you can see that the QQQs have consolidated in the upper inside of their range.
Because the QQQ’s index has a high concentration of tech stocks in its basket, it’s good to note the circulating idea in which an overbought tech sector could lead to a rotation into other areas of the market that have more potential upside.
If this is true, it’s important to keep an eye on the range to see if it can breakout over 295.36.
Some of the tech stocks are more clear that are in the NASDAQ basket.
For instance, Nvidia (NVDA) a tech darling and superstar during the holiday season, is not only below its election range high, it is teetering on its 50-DMA.
Using NVDA as a barometer, a move under $500 could spell trouble for the NASDAQ index in general.
Considering that the AAII bullish sentiment is near the all-time highs, watching NASDAQ during this incredible period of complacency, could give you an early head’s up about the coming holiday season and market.
S&P 500 (SPY) Confident buying into Fridays close. Support 350
Russell 2000 (IWM) Last week’s high 165.71 needs to hold. WIth Resistance at 176.61
Dow (DIA) Lots of consolidation this week. Looking to retest highs at 298.61 With support at 285 if can’t hold Thursdays low of 289.19
Nasdaq (QQQ) Major support at the 50-DMA at 279.89.With a topping pattern, this really needs to clear 299.14
KRE (Regional Banks) 45.16 Support. With Resistance at 48.83
SMH (Semiconductors) WIth a topping pattern, this really needs to clear 202.89
IYT (Transportation) 208 pivotal. With resistance at 218.58
IBB (Biotechnology) Trading within range 135.13 support and 143.36 Resistance.
XRT (Retail) Needs to clear and hold over 55.26.
Twitter: @marketminute
The author may have a position in the mentioned securities at the time of publication. Any opinions expressed herein are solely those of the author, and do not in any way represent the views or opinions of any other person or entity.


: Showing Some Signs of Emerging Strength")
