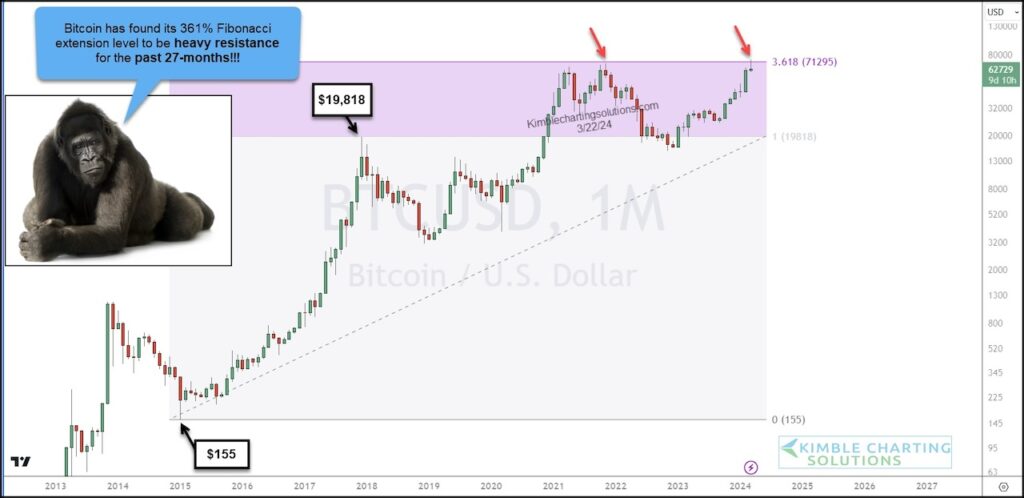
Bitcoin has struggle to overcome a very important price level for more than two years: the 1.618 Fibonacci extension level.
This price area is especially important as it marked Bitcoin’s original all-time high in November 2021. We eclipsed that this month, but price has fallen from those levels.
We can see this in this month’s long wick on the “monthly” chart of Bitcoin below.
If selling continues, we could end the month with a bearish reversal wick (and pattern). That’s a big “if” because there is still a week to go.
So stay tuned to see if how this potential bearish reversal ends the month! Will be interesting for sure!
Bitcoin “monthly” Price Chart
Note that KimbleCharting is offering a 2 week Free trial to See It Market readers. Just send me an email to services@kimblechartingsolutions.com for details to get set up.
Twitter: @KimbleCharting
The author may have a position in mentioned securities. Any opinions expressed herein are solely those of the author, and do not in any way represent the views or opinions of any other person or entity.

: Worrisome to Broader Market?")


