August 10, I appeared on CNBC Asia to discuss Alibaba’s surprise beat on earnings and China’s weak economic data.
I began the segment reminding investors (and myself) that regardless of the news, opinions of analysts and the talking heads, price pays.
It is with that in mind, I mention the following:
- Alibaba reported sales up 14% along with their improved margins.
- Biden banned US firms from investing China while China buys $5 Billion chips from Nvidia for use in AI. These chips are designed in the US and made in Taiwan and South Korea.
- China’s deflationary numbers come vastly from falling pork prices and transportation costs-this will not necessarily impact global inflation.
- The jobless rate of youth has risen to alarming numbers.
- China can print money thereby adding liquidity if necessary and most likely will do so.
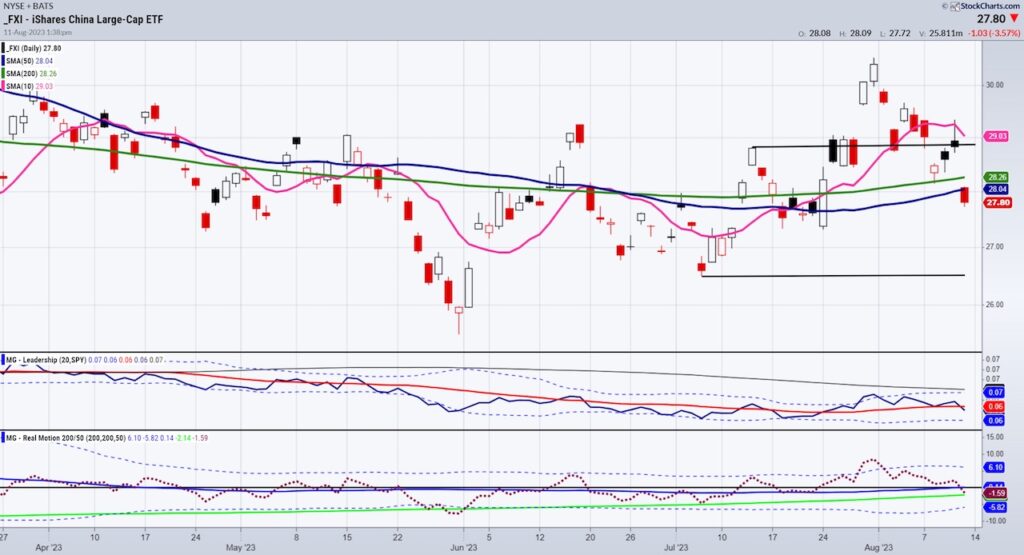
The chart of FXI, also featured on the Final Bar with Dave Keller-link below-indicates that the price, which failed the July 6-month calendar range high on Friday, fell into support.
On Thursday, the price sat on the July 6-month Calendar range high. In the clips, we say that FXI must clear $29.00.
The Real Motion indicator, even with the drop in momentum, remains in a bullish divergence as the moving averages are stacked with the 50 over the 200 DMA. The price chart that has yet to happen.
The Leadership also switched from FXI outperforming the SPY to underperforming.
Nonetheless, you can now watch momentum, leadership, calendar ranges and price as a guide for a potential investment.
View my latest tv interview: CNBC Asia (partial clip)
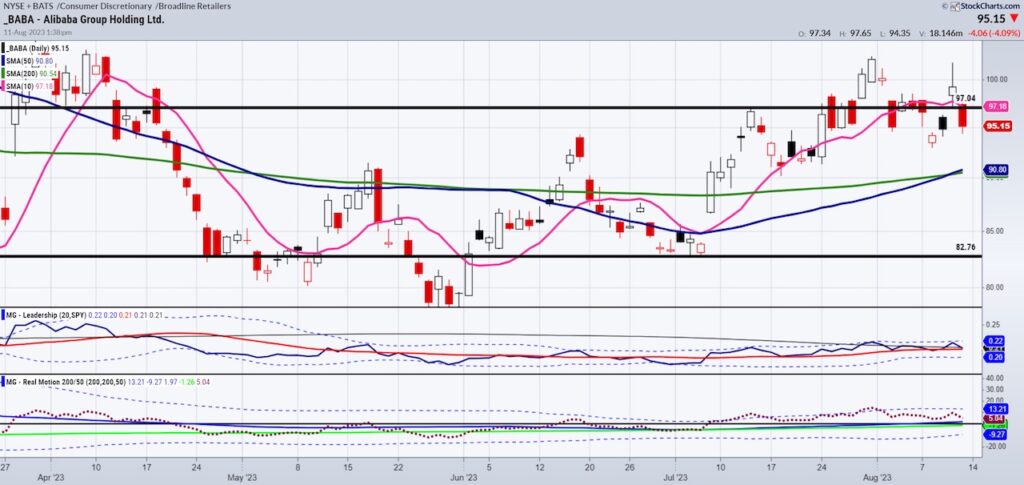
Alibaba BABA did better than FXI on Friday.
The phase is bullish. Price is doing a bit better than momentum.
BABA is outperforming the SPY.
Hence, this week we will look for a move back over the July 6-month calendar range high (97.04).
I will be off for a few days..enjoy and remember..
Price pays!
Twitter: @marketminute
The author may have a position in mentioned securities at the time of publication. Any opinions expressed herein are solely those of the author and do not represent the views or opinions of any other person or entity.

: Worrisome to Broader Market?")


