Recent data seems to cast doubt on the seemingly never-ending call for an imminent recession.
From a September 20, 2019 Bloomberg article:
“The U.S. economy is outperforming expectations by the most this year, offering a fresh rebuttal to last month’s resurgent recession fears fueled by the trade war and a manufacturing slump. The Bloomberg Economic Surprise Index has reached an 11-month high after four indicators released Thursday, including existing home sales and jobless claims, each surpassed expectations.”
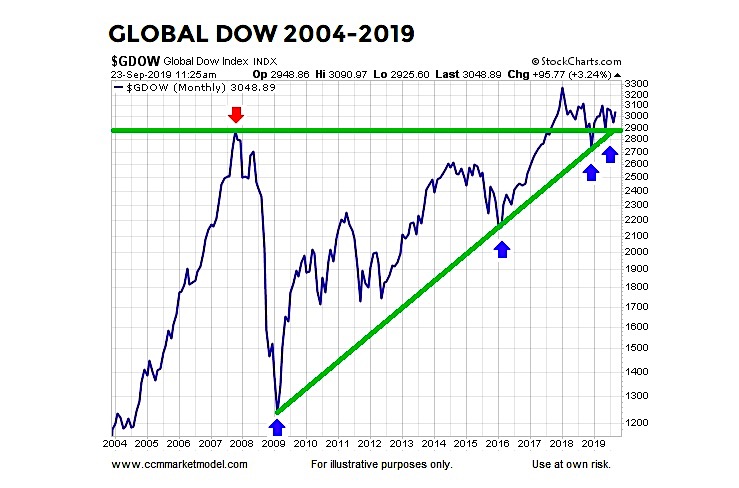
The Global Dow Index INDEXDJX: GDOW seems to support the “it is not that bad” theory.
The index has thus far held above an important area of possible support.
Global Dow Index Long-Term Trend Chart
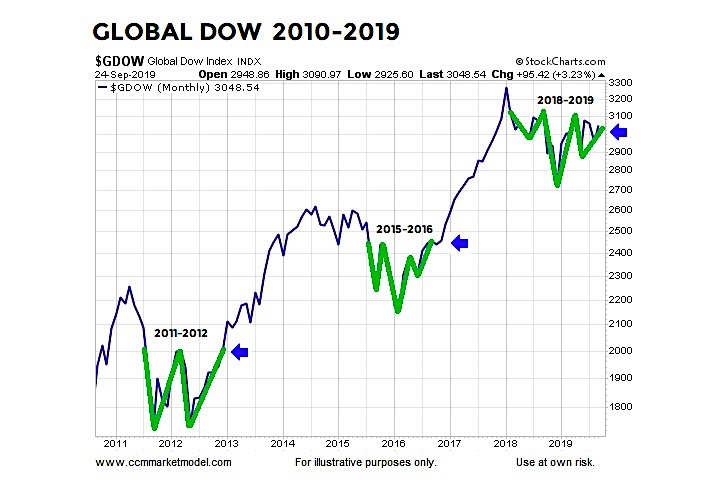
SIMILAR PATTERNS IN 2011-2012 AND 2015-2016
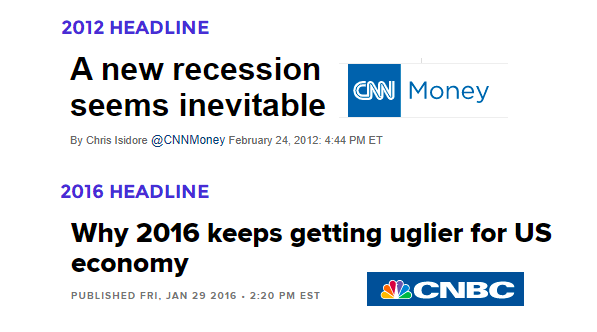
It was not difficult to find calls for an imminent recession in both the 2011-2012 and 2015-2016 periods (see dated headlines below).
In both periods there were legitimate reasons to be concerned and significant corrections in global stocks, similar to the October-December 2018 period. With economic data starting to exceed expectations, it is possible global stocks will break out as they did following corrections in 2011 and 2015.
ECONOMIC DATA AND BONDS
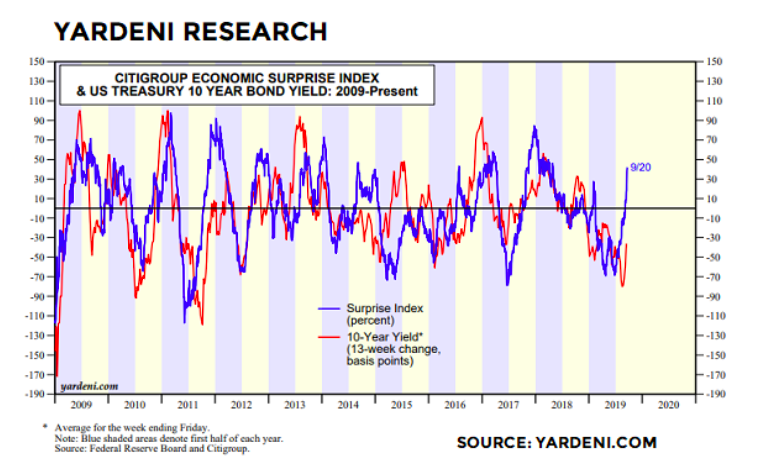
The Yardeni Research chart below shows the Citigroup Economic Surprise Index in blue and the yield on a Ten-Year Treasury in red. Low yields typically align with economic fear. Given the recent improvement in economic data, it is possible yields will once again follow the Economic Surprise Index higher.
Data related to the U.S. economy has been improving for some time now allowing the Economic Surprise Index to gain meaningful traction. From a September 10, 2019 CNBC article:
“The Citi Economic Surprise Index, after nearing its lowest level in two years in June, this week was at its highest point since February. The index looks at actual economic readings against consensus forecasts, so it will rise when expectations are too low and fall when optimism runs too strong. The latest move, then, can be seen as a recalibration of Wall Street’s overriding pessimism.”
SETUPS IN PLACE FOR MONSTER BREAKOUT
While China remains an obvious and important wildcard, this week’s stock market video provides numerous forms of evidence that tell us to remain open to much better than expected outcomes over the next twenty-four months. Topics covered include: the labor market, Fed, long-term S&P 500 Index trends, valuations, breadth thrusts, better than expected economic releases, credit spreads, sentiment, and the VIX.
Twitter: @CiovaccoCapital
The author or his clients may hold positions in mentioned securities at the time of publication. Any opinions expressed herein are solely those of the author, and do not in any way represent the views or opinions of any other person or entity.

: Cup (and Maybe Handle) Watch")
 Trading Near Top Of Price Range")

