I regularly scroll through all the charts in the S&P 500 as part of my research process.
Technical analysts that I respect a great deal convinced me of the value of this routine, which tends to increase your market awareness and decrease your vulnerability to market movements.
During a recent run through all 500+ charts, I noticed certain stocks that appeared to be unaware that the market had been in a correction. While many charts showed a clear down move from a peak in January to a lower low in February, these charts actually continued up and to the right as if nothing else had happened.
I made a note of the tickers and was not surprised to see they were all in Technology and Consumer Discretionary, which have been consistent leadership in the recent uptrend. I was very surprised to notice that the tickers quickly formed an acronym.
The stocks were Microsoft (MSFT), Amazon.com (AMZN), Netflix (NFLX), Intel (INTC), and Adobe (ADBE). That’s right, the stock tickers spelled out M-A-N-I-A. Too good to be true.
Here we see each of the five stocks along with 40-week and 150-week moving averages, RSI, and relative strength to the S&P 500.
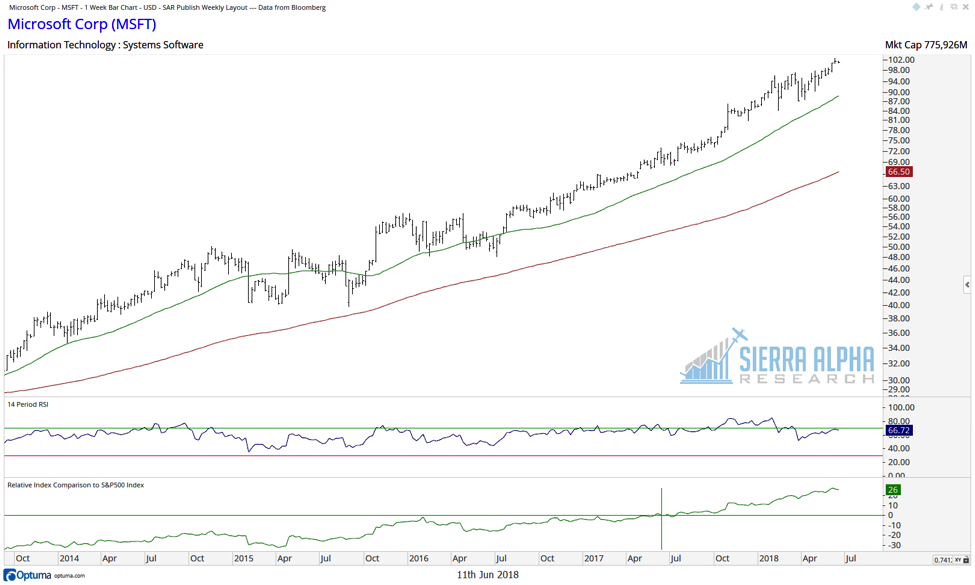
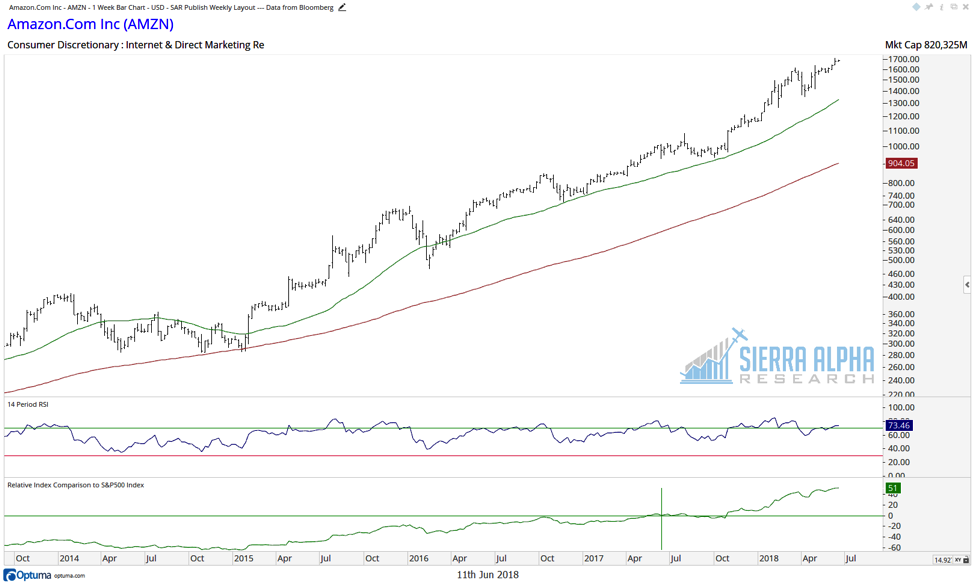
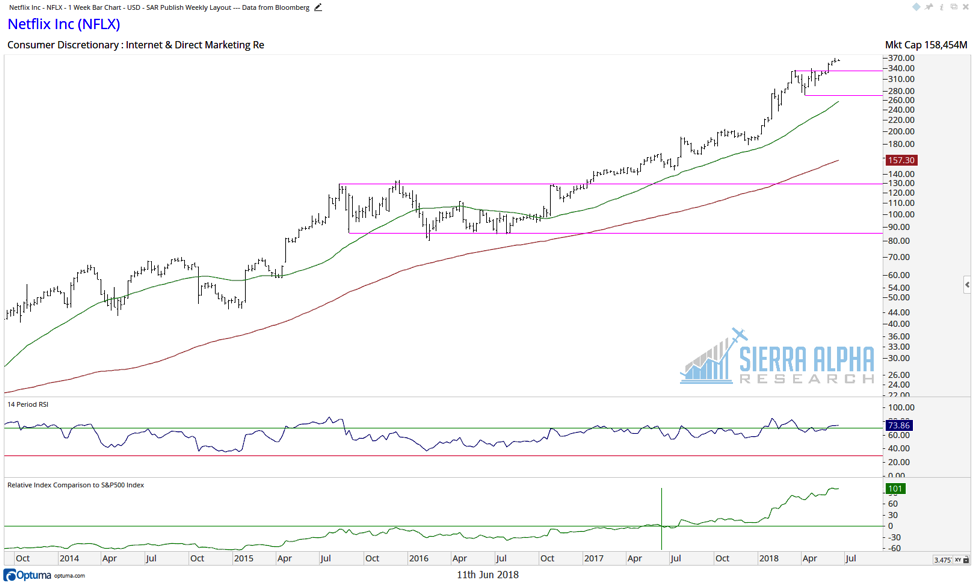
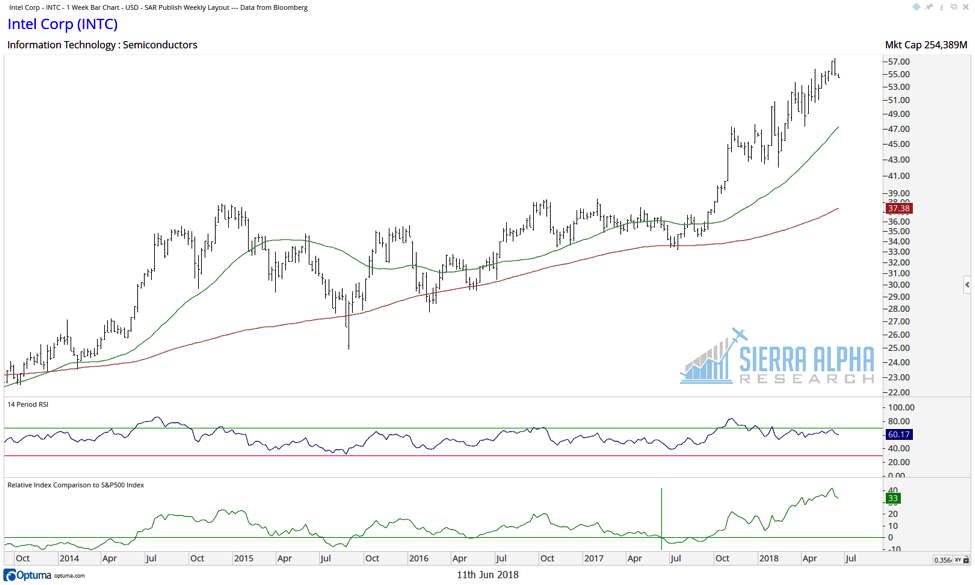
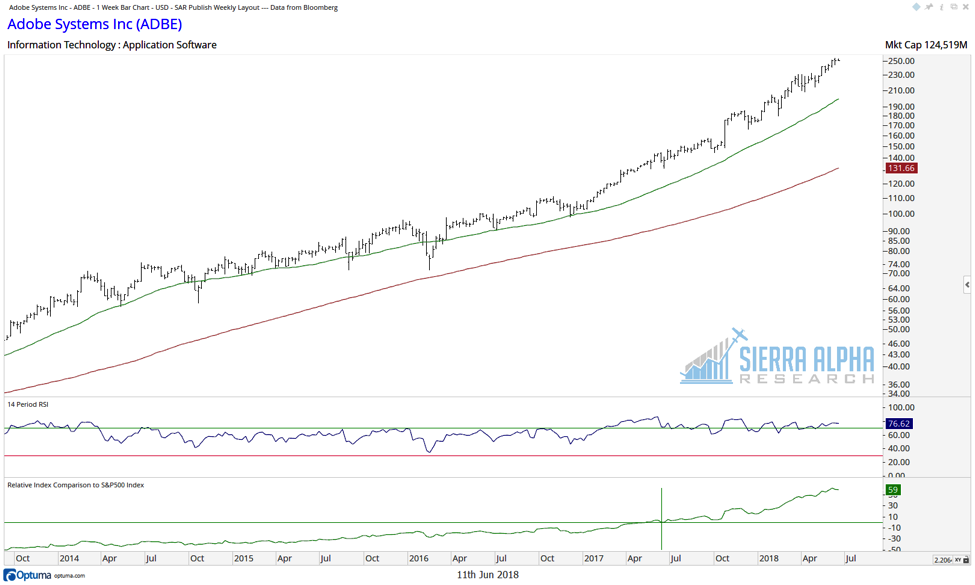
Notice how all five stocks are in Dow Theory uptrends with a consistent pattern of higher highs and higher lows. The price is above two upward sloping moving averages. By any measure, these names are in solid uptrends.
As I stared at this new acronym on the price of paper, I immediately thought of Charles Kindleberger’s infamous book, Manias, Panics and Crashes: A History of Financial Crises. It’s very interesting to note that while the book has been updated a number of times, the lessons are timeless as they deal primarily with human emotion and our appetite for excess.
The current market and economic environment certainly differs from Kindleberger’s classic characteristics of bubbles. However, I’m more interested in the behavioral aspects of market excess. Here we have a group of names that have remained resilient through a fairly traumatic short-term market environment. There is no doubt in my mind that money managers are herding into names that have shown strength.
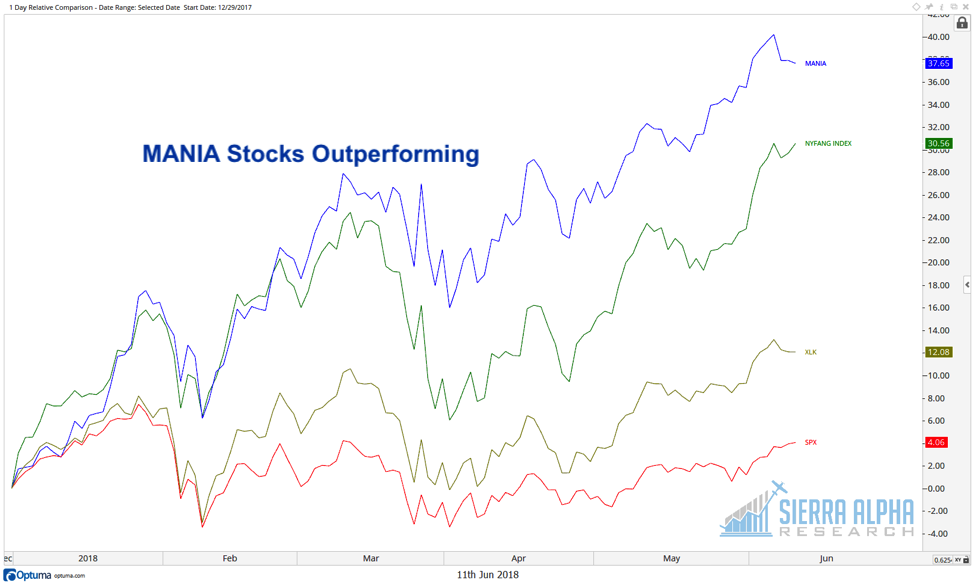
You may be wondering how the MANIA stocks compare to the FANG stocks.
A chart of MANIA relative to FANG (in this case, the NYSE FANG+ index) shows how this group of five stocks has been the real strength in 2018.
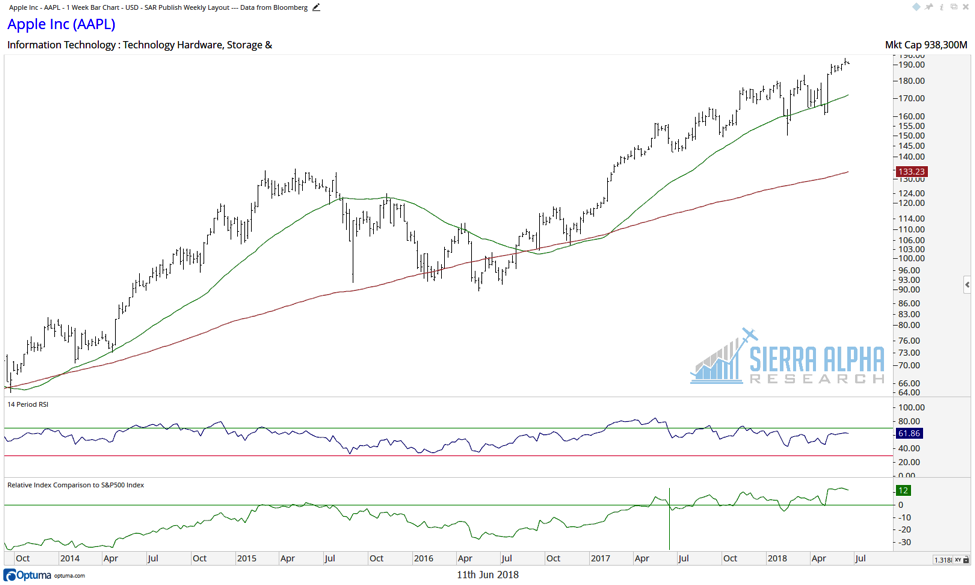
It’s interesting to note three key names that were not included in the MANIA list. Again, this was based purely on the charts in looking for stocks that had not shown any real signs of weakness in 2018.
Apple (AAPL), Facebook (FB), and Google (GOOGL) all broke down through their 200-day moving averages earlier this year. While AAPL has shown renewed strength and again traded to new highs, the severity of the selloff in February eliminated it from the list.
Why are the MANIA stocks relevant going forward?
The MANIA stocks represent leadership in a bull market phase. This is where investors have rotated in uncertain times, and it is where investors remain. When that leadership starts to falter, it would signify profit taking and a potential end to the uptrend. Until then, the MANIA charts suggest that the path of least resistance is higher.
Twitter: @DKellerCMT
Any opinions expressed herein are solely those of the author, and do not in any way represent the views or opinions of any other person or entity.


