The amount of resources thrown at trying to develop rules or models to predict turns or direction is truly immense. The problem, though, is that the financial markets are more of a social science given the number and behaviour of participants. You simply can’t solve for ‘x’. And even if you did, the market would likely change, and your model would stop working and you would be wrong.
It is with this view of the market not being solvable that we developed our Market Cycle framework. And it is this framework that is helping us to understand the current bull market and stock market cycle.
Instead of trying to solve for ‘x’, we endeavoured to find many equations or indicators that have worked in the past, with varying degrees of accuracy. Every market cycle is different which means some models will work in some cycles, while others will work in other cycles. The tech bust in the 2000-2003 bear was significantly different than the 2008-2009 financial crisis, and both will likely be different than the next cycle. We believe incorporating many, and gradually managing the turns, to be a more useful framework for tactically adjusting around your long term asset allocation.
The Market Cycle framework essentially diversifies across different models, different disciplines and different markets. Broadly speaking, these incorporate interest rates, aggregate index fundamentals, valuations, economic data and technical indicators. Each signal or model has some predictive capabilities and has proven so during past cycles. There are 30 indicators historically, and we have been researching a handful of new ones as well.
We use the market cycle to gauge how healthy is the current bull market. It is clearly late stage given low unemployment, the duration of the cycle, interest rates starting to rise and market leadership clearly evident. Obviously late in the cycle, these signals or models become more important, providing evidence of the bull markets continuation or demise. Given it is a late cycle, we have become more conservative, trimming equity overweights and moving close to benchmark. If these indicators started to deteriorate materially, we would be trimming more.
Let’s look at some charts and discuss what our indicators are saying.
Good Times
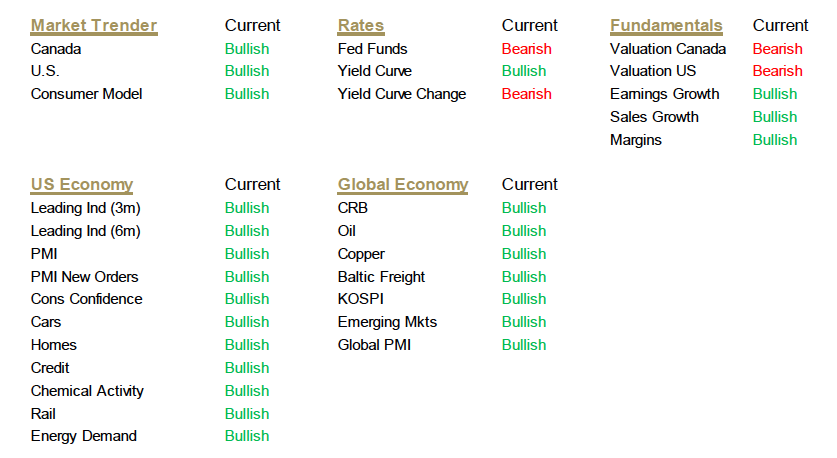
Looking at Chart 1, you can see the number of bullish signals are high, at 26 out of 30.
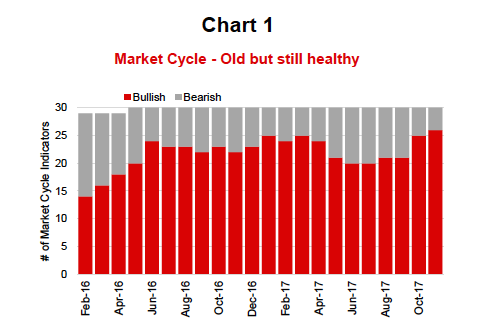
The only bearish signals are valuations, both in Canada and the U.S., and interest rates. The yield curve has been flattening over the past three months and the Fed has been raising rates. The rest are all bullish. This has us in the camp that the probability of a bear market or end of cycle is remote.
This doesn’t mean there won’t be a correction. The market is clearly overdue given the last significant pullback was more than 18 months ago. That is a long run without a correction based on historical standards. It has been 444 trading days since the S&P 500 has been down 10%. A very impressive run and to say we are due is likely an understatement. However, if the market cycle indicators remains very strong we would view a market correction still as a buying opportunity. The key is the market cycle indicators in conjunction with market weakness. And at the moment they are looking good.
A Few Charts
Below are a series of charts from our models/signals. The first (chart 2) covers fundamentals, including earnings growth, sales growth and margins. These are all positive and improving.
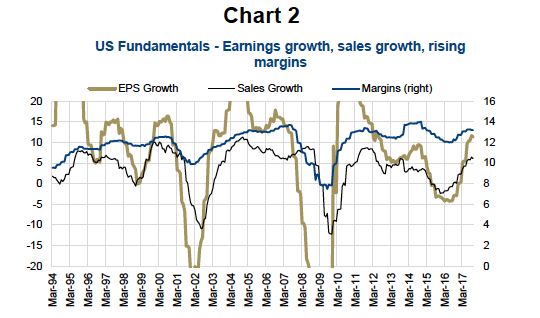
Chart 3 shows rates which are a slightly bearish given the yield curve has been flattening a little and the Fed Funds is on the rise. Chart 4 is market valuations. These are higher than average which is why this is not positive. Although worth noting, earnings growth is helping valuations and they are not obscenely high.
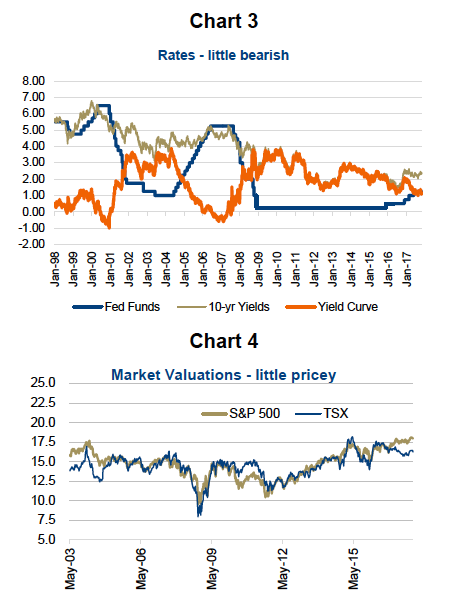
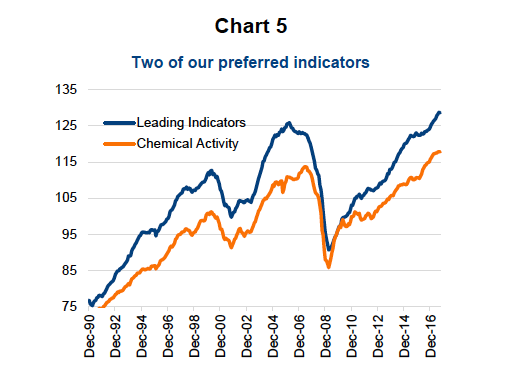
Chart 5 is two of our U.S. economic signals including Leading Indicators and Chemical Activity. The Leading Indicators signal is a basket of economic data points that have proven reliable in the past for predicting the direction of the economy. Chemical Activity is a very good leading indicator as chemicals are so early in the supply change they often feel softening demand before other areas.
Three New Models/Signals
While we currently don’t count them in our tally, we have incorporated three new models of which we do take notice. Two are U.S. economy focused including the Philadelphia Fed Coincident Index and changes in unemployment. The Coincident Index does not sound very forward looking, by definition of ‘coincident’ but it does provide a different look at the data relative to the aggregate levels. This index measures four statistics including employment, hours worked, unemployment and wages, but does so at the state level. As such, it can provide a forward warning ahead of the aggregate national data. Turning to unemployment, which is very lagging, we are actually looking for a 0.5% increase as the trigger. History has shown that when unemployment rises by 0.5% the U.S. economy always sees a recession in the quarters ahead. Even if unemployment is still really low, once it rises by 0.5% there is more to come as demand begins to soften.
The 3rd new model is the 2-month changes in high yield bond spreads. Rising spreads in the high yield can be an early sign of financial stress in the system. All three of these indicators are bullish at the moment.
Final Note
Overall the situation is pretty good. Although late in the cycle, we are confident at this point the cycle does have more room to run.
Data in charts sourced to Bloomberg unless otherwise noted.
Twitter: @sobata416 @ConnectedWealth
Any opinions expressed herein are solely those of the authors, and do not in any way represent the views or opinions of any other person or entity.


