The Value Line Geometric Index is one of the broadest stock market indices. So when its price records a notable reversal, breakout, or breakdown, investors should listen.
Today we take a closer look at the “weekly” chart of the Value Line Geometric Index and highlight why investors should be paying attention.
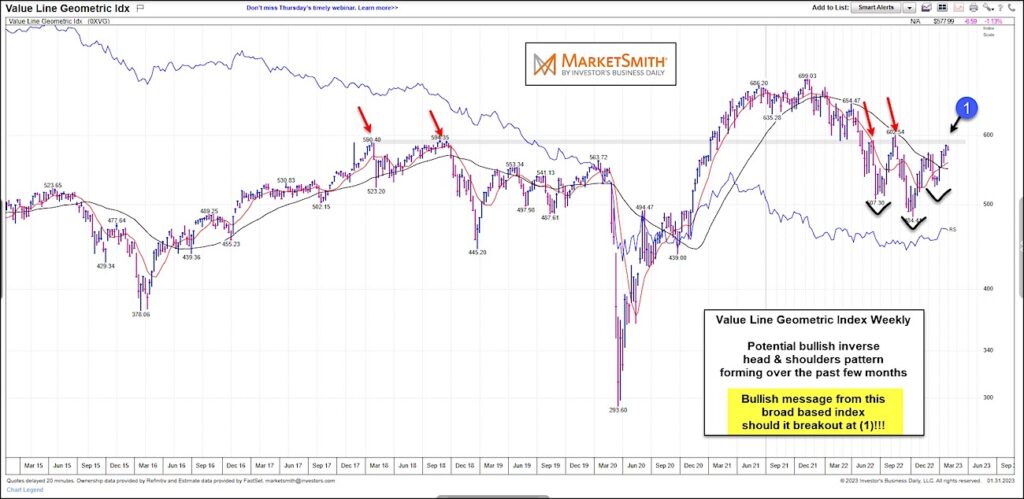
Like other stock market indices, the Value Line Geometric Index declined sharply from its 2021 high. While bottoming over the past few months, however, this index formed a wide base in what could be an inverse head and shoulders pattern.
The neckline for this pattern comes into play at (1) and it made even more important when we consider that this level has been resistance on 4 prior occasions. So this won’t be an easy breakout… That said, this would also make a breakout a huge development for bulls.
So keep an eye on this pattern and resistance. A breakout at (1) would send a very bullish message to the broad markets! Stay tuned!
Value Line Geometric Index “weekly” Chart
Note that KimbleCharting is offering a 2 week Free trial to See It Market readers. Just send me an email to services@kimblechartingsolutions.com for details to get set up.
Twitter: @KimbleCharting
Any opinions expressed herein are solely those of the author, and do not in any way represent the views or opinions of any other person or entity.


 and Semiconductors (SMH): Concerning Price Pattern?")


