The S&P 500 Index (INDEXSP:.INX) broke out above its 2007 highs long ago… but the same cannot be said for the broad “average stock” Value Line Geometric stock market index (INDEXNYSEGIS:VALUG).
Barry Ritholtz once wrote a blog post citing the difference between the Value Line arithmetic and geometric indexes.
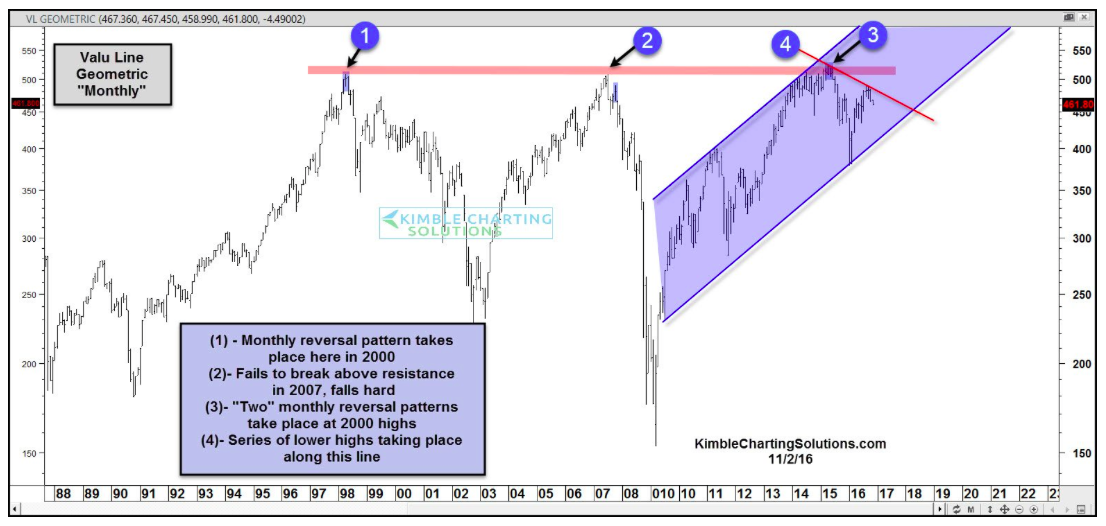
The chart below looks at the Value Line Geometric Index with monthly candlestick bars over the past 3 decades. This equal weighted index came about in 1961 and is based on a geometric average. It has been followed closely by market pros as a gauge of broad market strength because it provides insight into the “average stock”. Since it is based on a geometric average, the daily price change is closest to the median stock price change.
The price resistance line (pink) is pretty obvious. The index reversed hard at point 1, perhaps foreshadowing the tech crash. The index recovered in the early 2000’s and tested that high in 2007… but failed to breakout yet again.
3 times a charm? Nope. In 2015 the Value Line Geometric stock market index rallied back to to the ’00 and ’07 highs. After creating 2 monthly reversal patterns near those highs, the index formed a series of lower highs (the pink line labeled point 4).
This index is still trading well above support levels for its rising bullish channel (blue shaded), but it’s struggling to breakout over the downtrend line (point 4). A move over this line would set up a 4th attempt at a breakout to new highs.
It’s probably fair to say that what happens here is important.
Thanks for reading.
Twitter: @KimbleCharting
The author does not have a position in mentioned securities at the time of publication. Any opinions expressed herein are solely those of the author, and do not in any way represent the views or opinions of any other person or entity.


 Ready To Break Out?")


