When Charles Dow first wrote about industrial and railroad stocks in the Wall Street Journal, he stressed the importance of the averages confirming one another.
The theory being that if both the industrials (the producers of goods) and the railroads (the distributors of goods) were doing well, then the economy as a whole was doing well.
His July 21, 1899 editorial could have been written this morning (perhaps with more modern language):
“The upward movement in the industrial seems certainly to have started, and gives promise of continuing until the average of these industrials has risen to a basis considerably higher than the present. This movement may be safely counted upon to bring more or less sympathetic buying into the general list of railroad stocks as well.”
Things get interesting when the stock market indexes do not confirm one another. An example of this is mid-August 2017, when the Dow Industrials (INDEXDJX:.DJI) continued to new closing highs while the Dow Transports (INDEXDJX:DJT) were actually breaking to new swing lows.
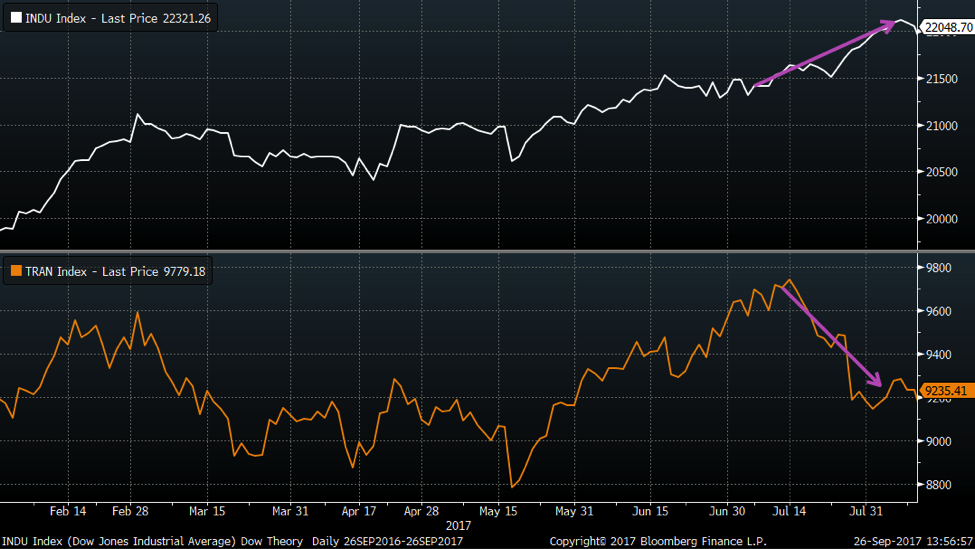
A divergence such as this one is not a sell signal for me. I’ve often found that divergences happen way more often than they are “correct” in calling a market turn. But it is a reason to monitor the price itself and see what happens next.
When I noticed that transports were close to confirming a new closing high, I thought a little about the composition of the index.
You see, the Dow Jones Transportation Average now includes not just railroads, but also shipping, trucking and airlines. When I pictured the charts of airlines in my mind, I was inspired to create this chart:
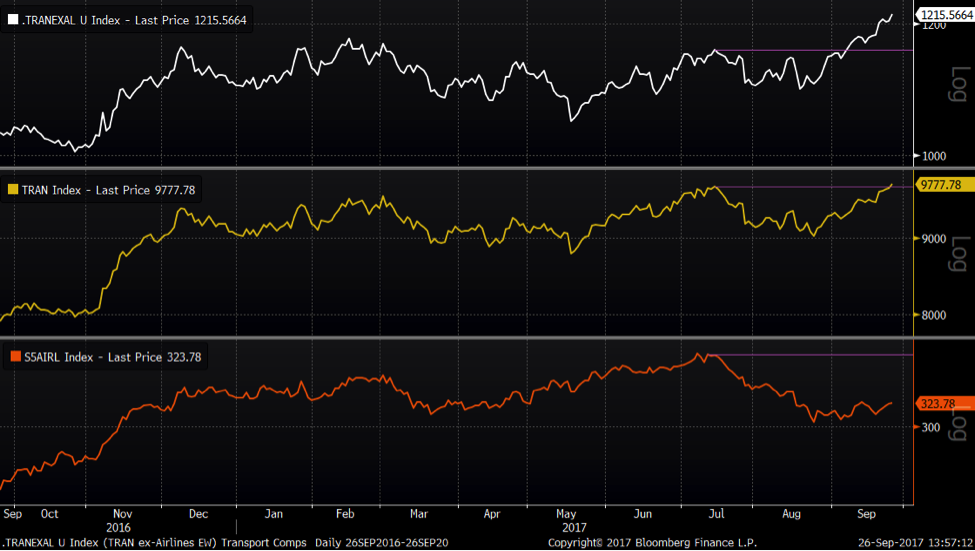
The middle panel (yellow) shows the Dow Transports Average, the bottom panel (orange) shows the S&P 500 airlines group, and the top panel (white) shows an equal weighted transportation average without the airlines. Notice how much the airlines are dragging down the index?
When you strip out the airlines, the true “distributors” of goods are well above closing highs, suggesting further upside for the market as a whole.
Twitter: @MktMisbehavior
The author may hold positions in mentioned or related securities at the time of publication. Any opinions expressed herein are solely those of the author, and do not in any way represent the views or opinions of any other person or entity.
ALSO READ: Making Sense of a Market of Stocks


