In a recent appearance on Bloomberg Television, I pointed out that the Financial stocks (NYSEARCA:XLF) have the most to prove leading into earnings season.
A review of the charts shows there is plenty to be concerned about, from the big banks to the asset managers.
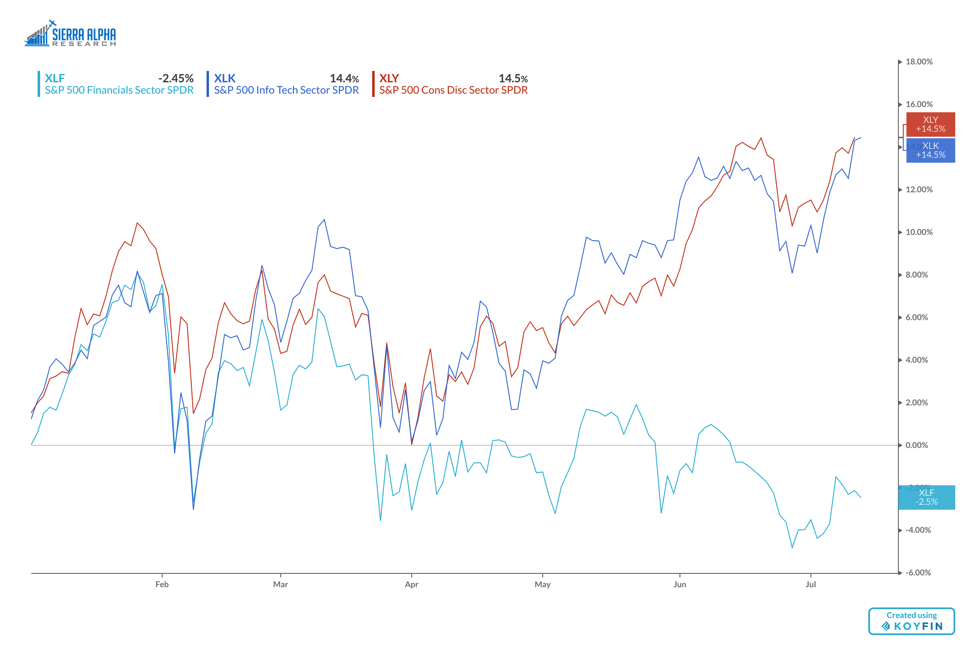
While megacap Technology (NYSEARCA:XLK) and Consumer Discretionary (NYSEARCA:XLY) names have been pushing the market higher, the Financials sector has seen a short-term pattern of lower highs and lower lows.
Here’s the YTD performance of these three sectors. Note how the three traded in a similar fashion in the first quarter, before their paths clearly diverged in the second quarter.
Performance Chart – $XLF vs $XLK vs $XLY
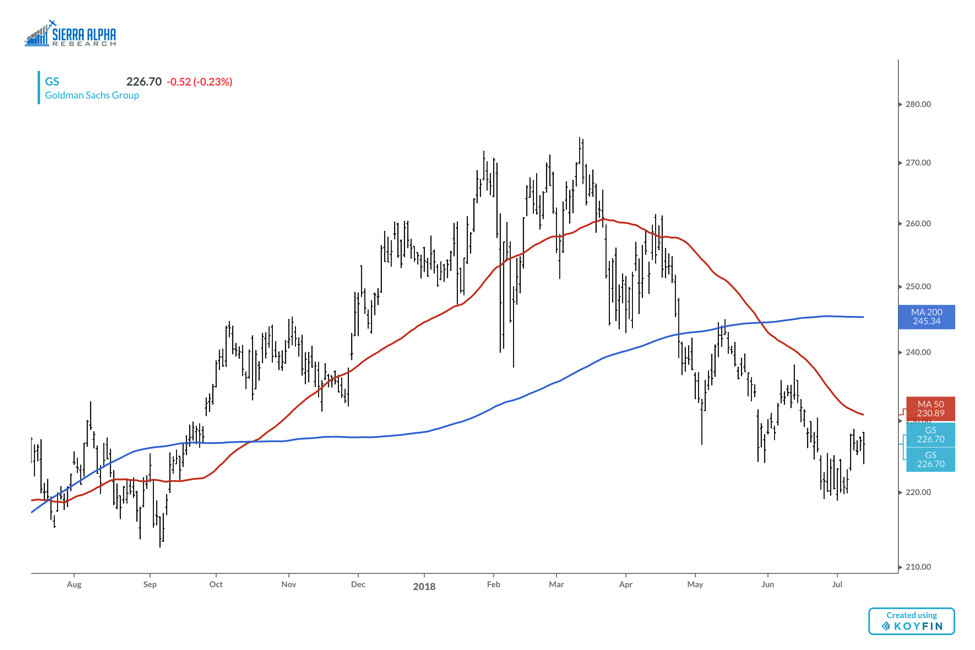
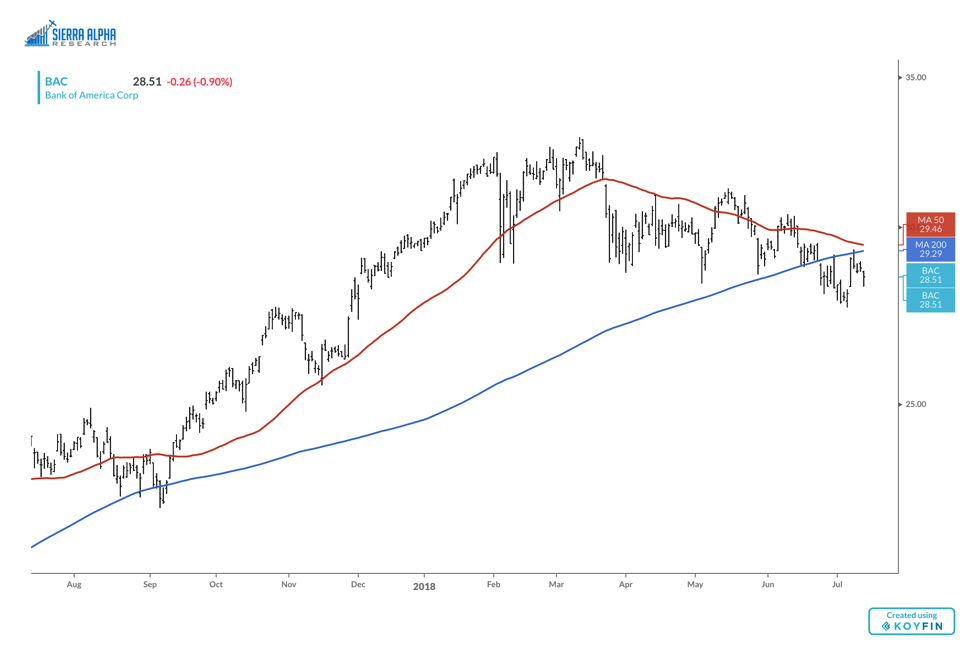
 In fact, the charts of some of the larger banks have been disturbingly weak, with names like Goldman Sachs (NYSE:GS) and Bank of America (NYSE:BAC) breaking down through key support levels. Note how BAC has just recently broken down through its 200-day moving average.
$GS Goldman Sachs Stock Chart
 $BA Bank of America Stock Chart
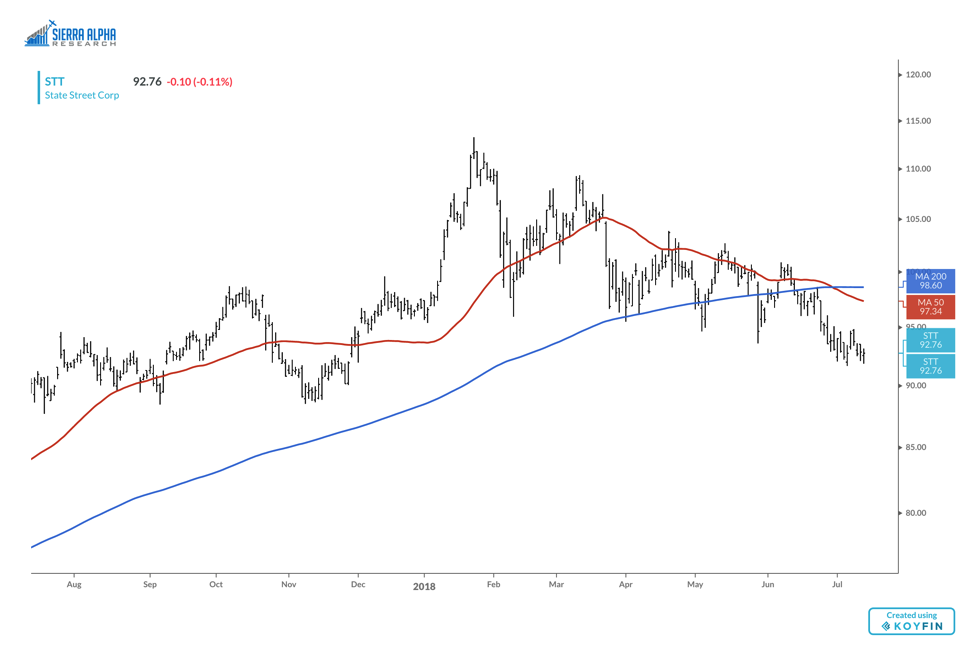
 Many of the asset managers have seen similar patterns. Here we have State Street Corp (STT) recently violating its 200-day moving average and nearing another new low this week.
$STT State Street Corp Stock Chart
 There are some bright spots in the Financial sector. The exchanges come to mind, with many in established uptrends and consistently breaking to new highs.
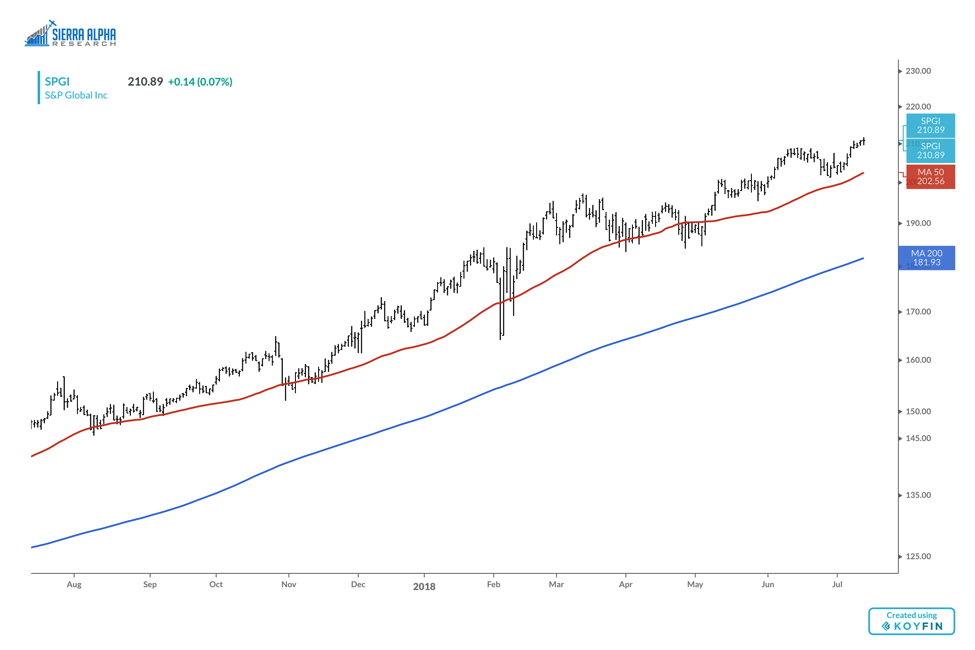
S&P Global Inc (SPGI) comes to mind as the type of name that looks more like a Consumer or Tech name than a Financial stock. SPGI reached another 52-week high this week, and remains above two upward sloping moving averages.
 As the big banks begin to report earnings, the weight of the evidence is clearly bearish on the short-term charts. Until we see some sort of accumulation on the charts, we have a pattern of lower lows and lower highs with no end in sight.
Twitter: @DKellerCMT
Any opinions expressed herein are solely those of the author, and do not in any way represent the views or opinions of any other person or entity.


