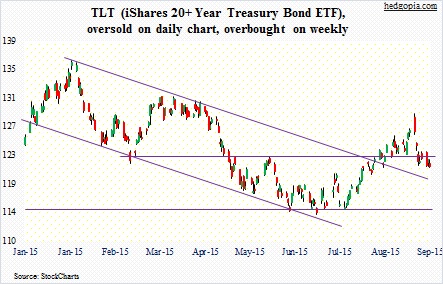
In the past five weeks, all things in the world of bonds have done a lot of running… but on the treadmill. The popular bond ETF, the iShares 20+ Year Treasury Bond (TLT) is essentially unchanged during that time (at $120.98). But if there was any movement, it was mostly to the upside.
Once it broke out of a seven-month down-sloping channel in early August, in a matter of a few weeks it shot up to the August 24th high of $128.64. The move in bonds was not due to some visible change in macro data; it was due to the technicals.
U.S. economic data have continued to portray a rather soft picture, interspersed with occasional strength. But they have been that way for a while. At the same time, the Fed has continued to stay on its message, which is that a rate hike is coming this year. Although of late the message has been muddled at best. Bill Dudley, president of the New York Federal Reserve, sounds like he would like to wait and not go for a rate hike in the FOMC meeting in two weeks, even as Stanley Fischer, Federal Reserve vice chair, left the door open at Jackson Hole. Several other FOMC members are similarly divided.
The resulting confusion is reflected in the price action on the TLT and other related bond ETFs and bond indexes..
The TLT is caught right between its 200- and 50-day moving averages. As things stand now, it is overbought on a weekly basis, with momentum indicators already pointing lower. As a matter of fact, last week produced a huge bearish engulfing candle.
In the near-term, however, bonds could move either way, although there still is a downside bias. TLT is oversold and right above its rising 50-day moving average. But at the same time, in three of the last six sessions, the 200-day moving average rejected rally attempts. In other words, it is in a limbo – perhaps fitting to stay out of bonds for now.
To recall, on July 30 August 7th 121 naked calls were hypothetically sold for $0.83, for effective short at $121.83. Time to cover for a small profit of $0.85.
Thanks for reading!
Twitter: @hedgopia
No position in any of the mentioned securities at the time of publication. Any opinions expressed herein are solely those of the author, and do not in any way represent the views or opinions of any other person or entity.

 Rolling Over At Key Fibonacci Level?")


