Bonds have experienced a dramatic selloff that has wreaked havoc on retirement portfolios that thought government bonds were a gentlemen’s investment.
And as long as interest rates keep rising, bonds will continue to underperform.
BUT, as you know, investments/prices/trends don’t rise in a straight line.
So what do we expect from bond yields and interest rates? Below are two charts (intermediate and long-term) to help you think about it
Note that the following MarketSmith charts are built with Investors Business Daily’s product suite.
I am an Investors Business Daily (IBD) partner and promote the use of their products. The entire platform offers a good mix of analysts, education, and technical and fundamental data.
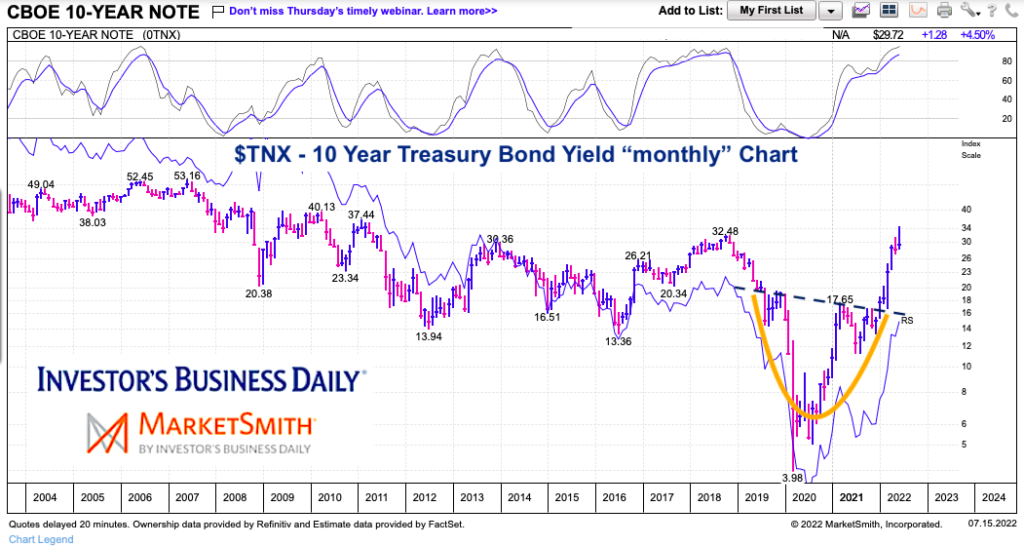
US Treasury Bond Yields “monthly” Chart
I like to keep things simple. Here we can see that interest rates broke out of an inverse head and shoulders pattern and reached as high as 3.4%. We can also see that the rally peak ended up near 10 year highs. Looks like a COVID triggered a trend change.
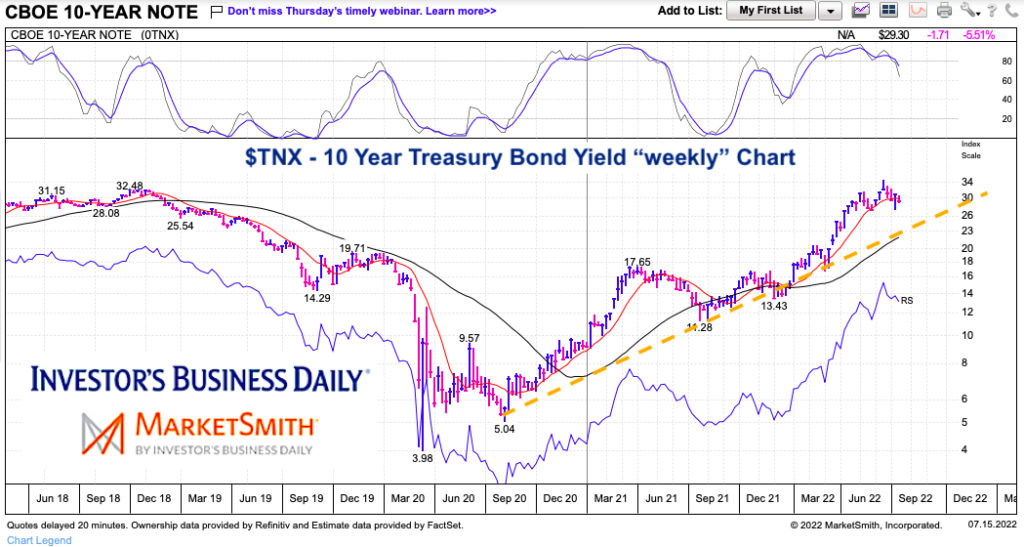
US Treasury Bond Yields “weekly” Chart
Looking at an intermediate time frame, we can see that interest rates may have gone too far, too fast. And based on the trend-line, they could still come down a bit before resuming higher.
While this may mean lower rates near-term, the chart above keeps me bullish interest rates longer-term.
Twitter: @andrewnyquist
The author may have a position in mentioned securities at the time of publication. Any opinions expressed herein are solely those of the author, and do not in any way represent the views or opinions of any other person or entity.


 Flirting With Critical Support… Again")


