Technical Analysts are not Pollsters or Economists
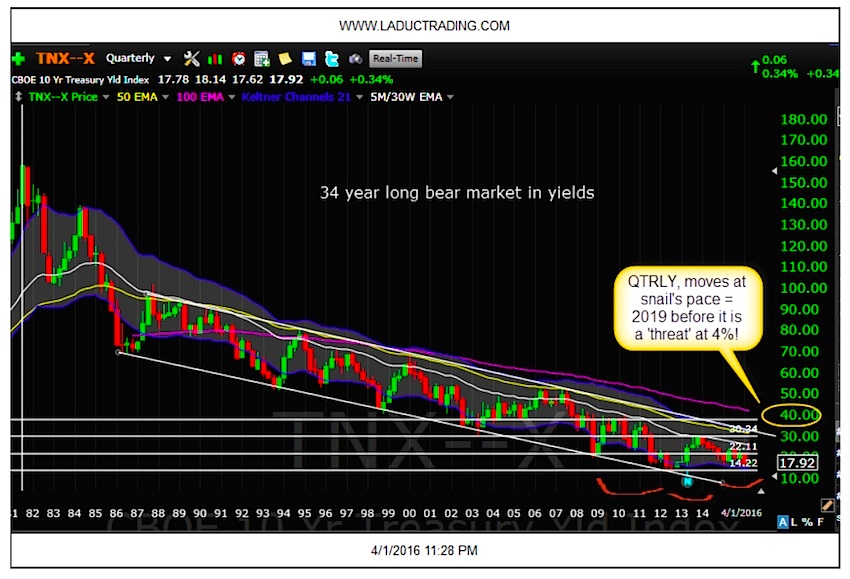
Back in April, I posted this chart of the 10 year Treasury Yield TNX and presented my analysis to the Boston Investor’s Group at MIT, suggesting that if rates stayed above a Quarterly Close of 1.42%, then rates were set for higher. (And that was not based on Trump, economic health, US dollar or FED!) Based on that nice inverse Head & Shoulders on this Quarterly chart, my price targets were 2.21% by year end then 3.03% mid 2017. That’s when it runs into Quarterly Trend line resistance which should be formidable. Until it isn’t. Beyond 3%, it is not hard to imagine a measured move from that inverse head & shoulders to 4% then 5% and in time to 6%, but it needs a few years. Unless the 1946 analog teases out.
Wow That Was Fast
Six months after presenting this chart, and soon after the Presidential election, those 20 year rates are at 2.31% and half way to the top of that long 34 year long channel in yields at ~3%. Why so fast?
Back in July, the market slowly started pricing in a 2016 December FOMC announcement of a rate hike. Then, Trump got elected.
- During the election week alone, the 10-year yield jumped 21%–the largest weekly gain ever.
- Bloomberg reports that bonds around the world headed for their steepest two-week loss in at least 26 years.
- The Wall Street Journal referenced the premium (or spread) between 10-Year Treasury and 10-Year German yields, had climbed to their highest levels since 1989 (27 years ago).
Rates gapped higher on bets that fiscal stimulus and deregulation will pump up growth, kick-start inflation and relieve the pressure on the Fed so they can continue normalizing rates, and at a quicker rate.
So What’s Normal?
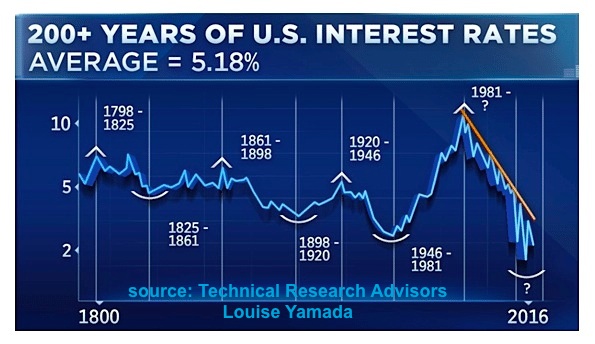
Speaking of normalizing rates, Louise Yamada recently posted a chart that reminds me that the mean for interest rates is closer to 5%. As current rates are outliers, they can and will revert.
Bonds are Dead; Long Live Bonds
The bond market is not dead, but it is broken. Bonds will still be a safe haven and catch a bid when SPY pulls back, when USD pulls back, when TNX pulls back. Active traders know the drill. More importantly, Fund managers will circle back into bonds should higher borrowing costs alongside a rising dollar damage worldwide business prospects or if U.S. debt gets downgraded from higher deficits.
Bonds, Gold, beaten-down currencies like the Yen can all catch a bounce (especially on Fib Retrace levels like now) and with that Rates, not to mention Financials, Industrials, Infrastructure/Transportation stocks, can all pull back as they work off the euphoria of Trump pro-growth promises. But the Short Bond trade is not likely done.
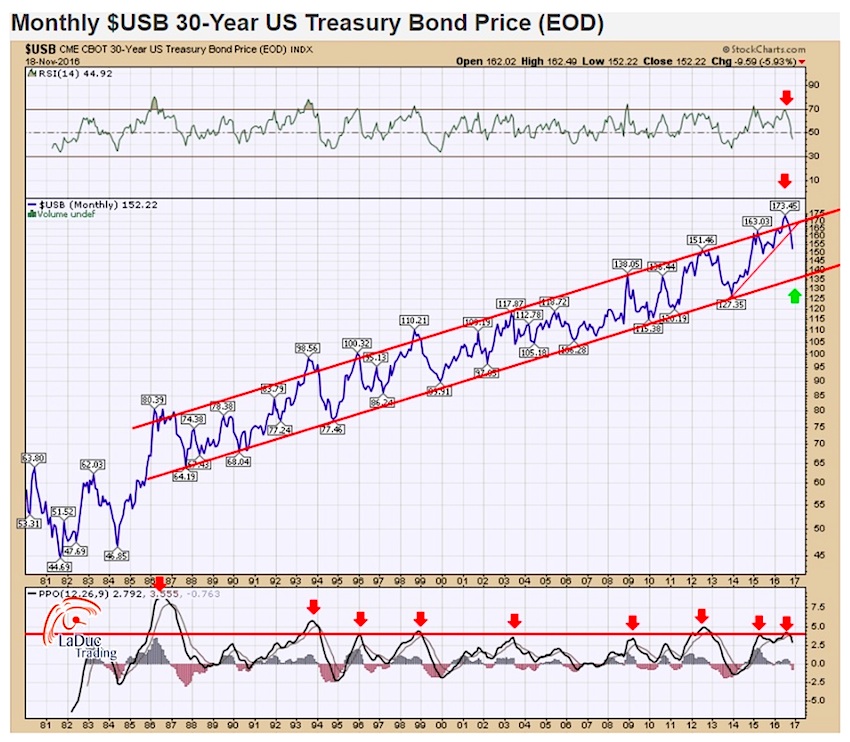
From a technical perspective, we are only about half way on the 30 year Treasury Bond pullback to channel support. Maybe a better place to try long would be ~$135 in hopes we bounce off that bottom channel.
What then? Having said that, Sentiment Analysis tells me those bond buyers aren’t going to walk away without a fight. In the same way those fiscal-conservative types in Congress won’t allow Trump a blank check or rubber stamp an agenda that increases the national debt driving deficits to a point of breaking the back of future economic growth.
Follow The Yen and US Dollar
Japan was The Tell: I believed and wrote Sept 21st that the 10 yr yield on JGB was just beneath the zero rate for the last time. With the BOJ setting the new cap on benchmark rates at zero, my bet was that they would defend 100 USD/YEN and that the FED would help. Translation: I watched for the trigger to short the Yen and go long the USD using FXY and GLD GDX as my proxies short. That worked.
And I see no reason why it will change. With Japan keeping its long-term rate pegged to zero, it will just print Yen until it gets the inflation it wants. So keep this foremost in mind before going all in on TLT, USB, GLD, GDX, etc, as price action in these instruments has technically followed the FXY script amazingly well this Fall.
Needless to say, Yen short thesis corresponded well with not just the Bond/Gold short thesis but the rise in the US Dollar, and may have helped fuel the USD advance. I know that seems a stretch, but Japan is the world’s third largest economy and our 4th largest trading partner, Bernake advises the BOJ, and isn’t it all very curious how US yields and US dollar spiked soon after they announced Japan had just gone unlimited QE?
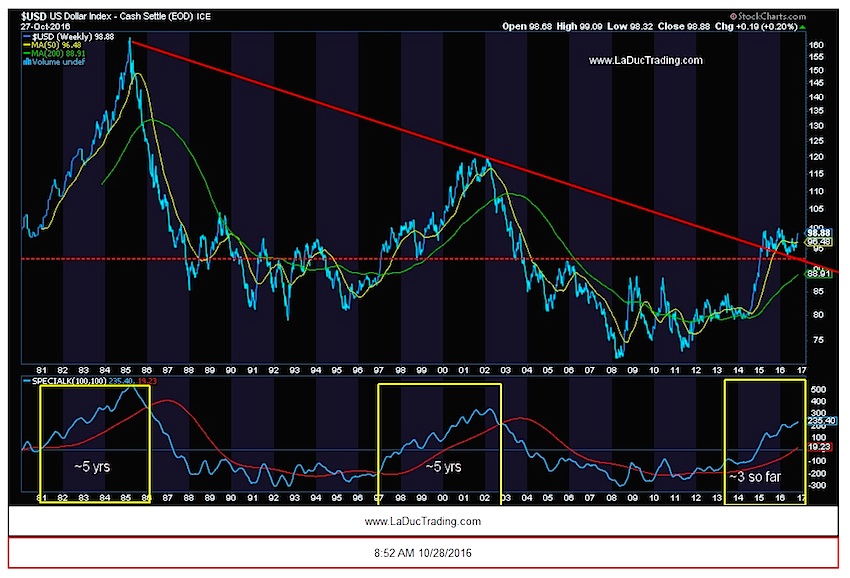
The BOJ has a mission: devalue its currency into prosperity. And they will do this by inciting inflation, spending freely, devaluing the yen in an effort to monetize its huge and unsustainable debt burden. Not sure how else to view this besides dollar bullish. Also, a rising USD is de facto tightening so it’s doing the FEDs work for them until growth metrics can justify more rate increases. Oh yeah, and the chart of USD has time on its side based on past cycle analysis.
Presumably, a pro-growth Trump agenda coupled with a rate-hiking Federal Reserve means higher rates and with it a break of the three-plus-decade bond bull market. This Thesis looks likely to play out especially in light of the Trigger of Inflation. I believe the 1946 Analog of much-higher inflation, converging with multi-decade lows in commodity prices, and an unprecedented, orchestrated Yen devaluation could be be the macro backdrop that propels US yields and US dollar much higher.
Thanks for reading and Happy Trading.
To receive Samantha’s Free Fishing Stories/Blog, it’s easy to subscribe.
Twitter: @SamanthaLaDuc
Any opinions expressed herein are solely those of the author, and do not in any way represent the views or opinions of any other person or entity.


