S&P 500 Bulls and Bond Bears Pin Hopes to 1946
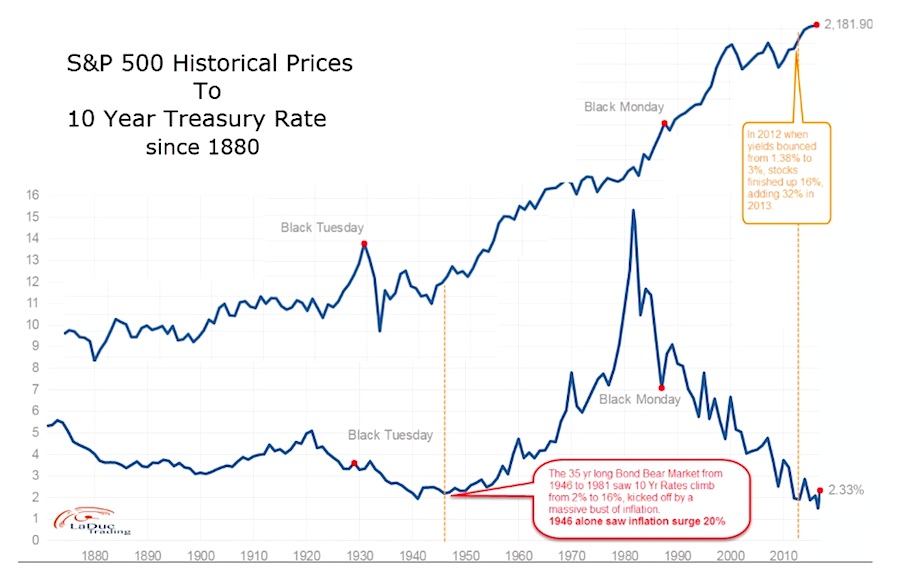
Interest rates follow very long term cycles. Above highlights a 35 year (1946-1981) bond market–but unlike our most recent 35 year (1981-2016) bond market, they were in a rising rate environment (for more than a blip on a chart). From a low of 2% to a high of 16%, yields were rising and bonds prices were not. A series of labor strikes in 1946 pushed the American economy into an inflationary spiral so much so that inflation surged 20% that year.
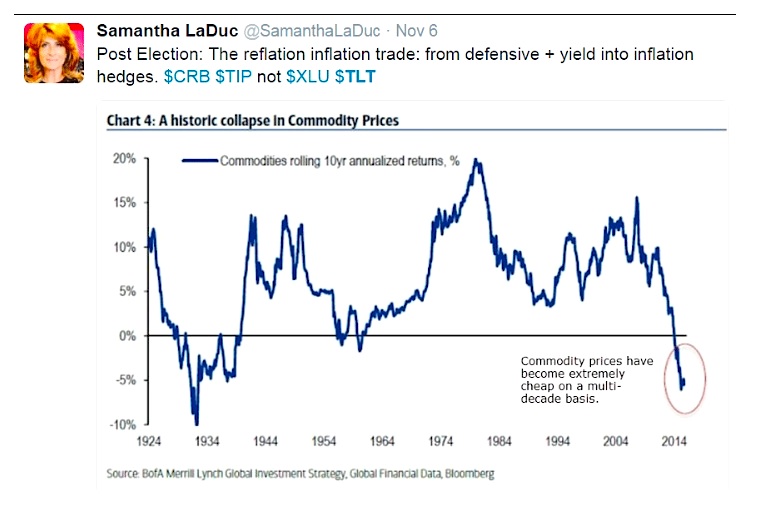
Fast-forward to modern day, we have seen commodity stocks of late basing and in some cases breaking out of long-term consolidation patterns after a very intense 8 year decline. Steel, coal, and copper have had out-sized runs. Even TIPs (inflation-protected bonds) are back en vogue. This historic collapse in commodity prices has made their underlying stocks become extremely cheap on a multi-decade basis. Will this commodity exuberance signal ‘the’ turn in inflation expectations moving forward? Will another inflationary burst–marking the exact reversal point in the interest rate cycle–make a return visit like in 1946?
Back to Even
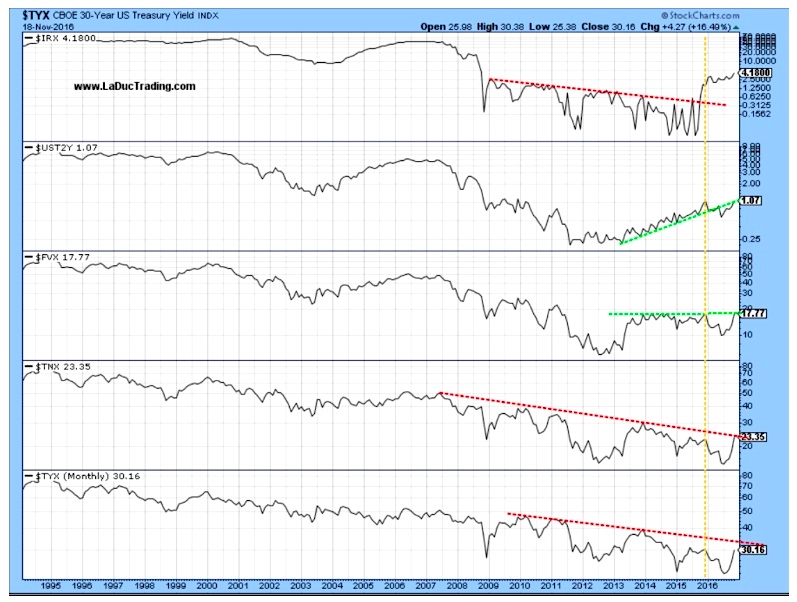
As we head into the 2016 December 14th FOMC meeting, where it is ‘practically assured’ that the Fed will raise interest rates, it is worth a look to see where bond prices and yields were back in December 2015 when the FED last raised rates. Here is my chart of Monthly Treasuries from short-term to long-term: 3 mos, 2, 5, 10, + 30 Yr Bond Yields. See that yellow dotted line? Yup, that’s when the FED raised rates last December and despite a once-in-26 year yield jump (and bond dump) past month, we are now pretty much back to even.
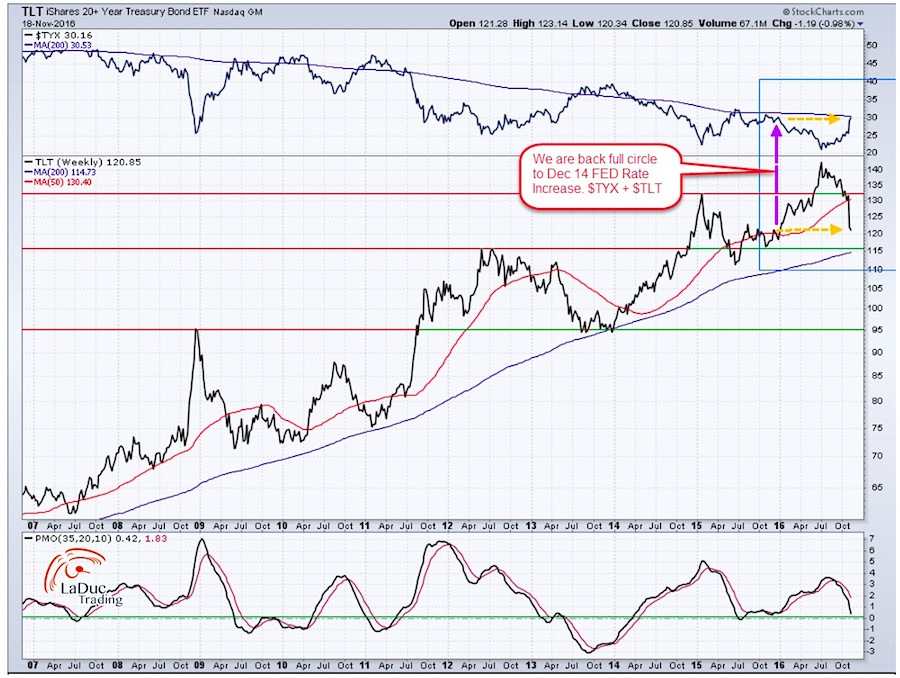
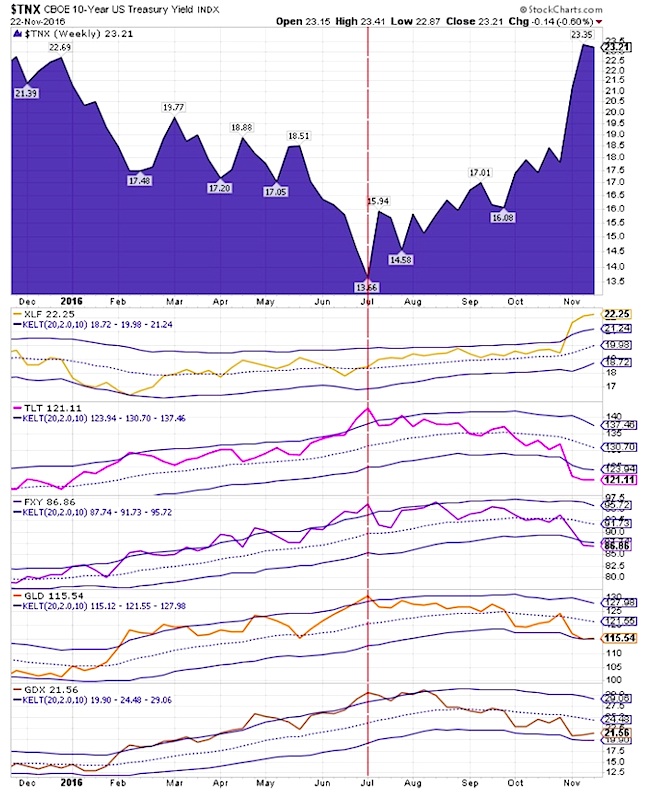
Although the 20 Year Treasury Bond ETF TLT is back to where it launched–from that FED rate rise in December 2015–there isn’t such great support until the 200D simple moving average around $115. Many are looking for the all-clear sign to jump back into TLT, and a 100% retracement sounds like a good spot, but I make it a practice to have a Thesis and a Trigger, in this case, a Trend Reversal signal for more than an intraday chase.
Intended Consequences
Yields affect correlated asset classes beyond Bonds prices. Gold lost its luster as negative world yields turned positive, driven in large part by US yields, making the risk/reward of holding gold less desirable over dollars for example.
- Gold lost 61.8% of its advance this year.
- Yen has also lost 61.8% of its advance this year but that was orchestrated.
- Barclays Total Return Index lost 50% of its advance this year.
- 20 Year Treasury Bond Fund has given back 100% of its 2016 gains.
Note these are pretty important Fibonacci Retracement Levels so I would not be surprised to see some pretty nice bounces but I also believe the move down is not done. Saving that for the end.
Ironically, despite a 100 basis point advance in the 10 Year Treasury Yield since July, a 7% higher US dollar, and busy sellers of bond funds, gold, Yen/Euro/Pound, the S&P is higher by about 7%. And that is after a heavy sell off in S&P components that include interest-sensitive REITS, Utilities and Staples. Oil, for the most part, has traded heavy but sideways leading into the OPEC meeting November 30th. Other than commodities, that fuel the inflation reflation trade, it was outsized gains in Financials, Industrials and Transportation stocks that led the charge Post-Election and the SPY rally. Banks sure were excited; the XLF as up 9% post election, its best week since 2009. In fact, they are fast approaching their 2015 Volker Rule Highs.
Unintended Consequences
Emerging market stocks have seen massive outflows on the rising dollar, rising bond yields and possibly fears of potential trade wars. Another reason why the dollar has gotten so strong this month is that U.S. bond yields are moving up faster than foreign yields. Beware the tipping point for Emerging Markets:

Bad news bears Druckenmiller and Dalio agree the secular cycle of falling interest rates is now over and rates have only one direction to go. According to Dalio:
…With interest rates having declined, the effective durations of all assets have lengthened, so they are more price-sensitive. For example, it would only take a 100 basis point rise Treasury bond yields to trigger the worst price decline in bonds since the 1981 bond market crash. And since those interest rates are embedded in the pricing of all investment asset that would send them all much lower.
So tail-risk of impending global recession is a big worry, especially if wages don’t rise more than inflation.
continue reading on the next page…


