US Treasury yields have been an investor focus for a long time.
Many have been pretty sure yields and inflation were going to rise for years, but the US Long Bond is still trading where it was in 2013.
It might be taking forever, but we have evidence that this gigantic ship is slowly turning the other direction. In fact, we might be seeing another rip higher in yields soon.
If we just take a simple long term view, we see that the 30 year Treasury broke a 3 year topping pattern last winter. Throughout 2018, it has just consolidated below the breakdown area.
30 Year US Treasury Bond
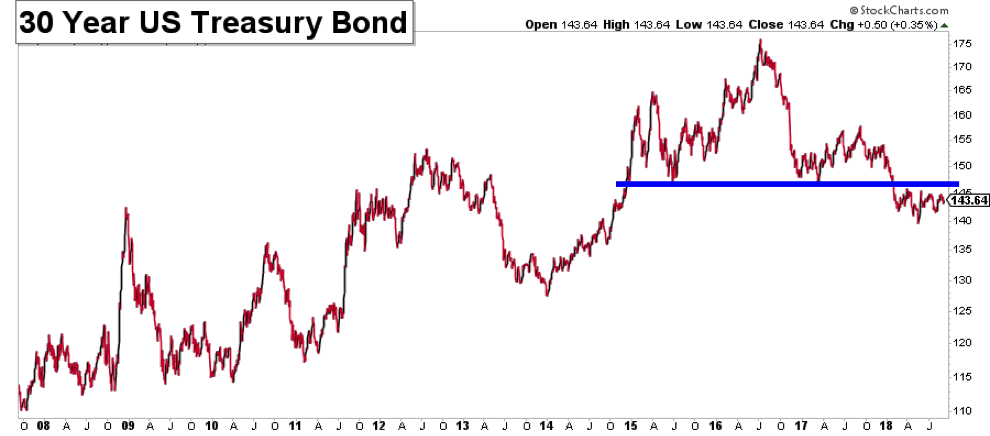
Price has tried to make a higher low and form a bottom, but the 145-146 area has proven to be a lid on price and dominant trend in play is lower. This appears to be a downside continuation, which is just what we’d expect given the timing and placement. A clear move over 146 and hold above and that’d change the story.
Looking at 20+ Year Treasury ETF (TLT), we see it is taking forever for this thing to break down. It’s as if it’s just working through a process in which a breakdown will follow. Uptrend after uptrend has been lost as price is now sitting just above a very sturdy gradual support.
$TLT 20+ Year Treasury ETF
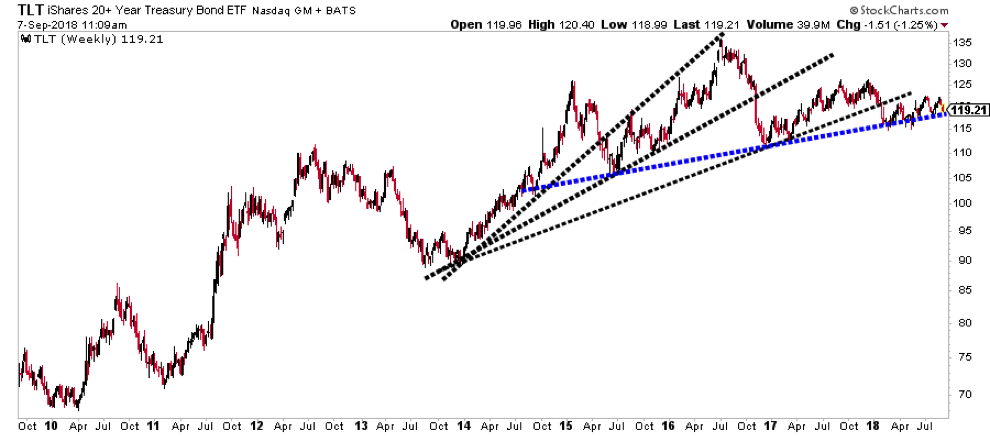
If TLT clearly breaks down from the Year-To-Date low 115, that sets up a strong move lower.
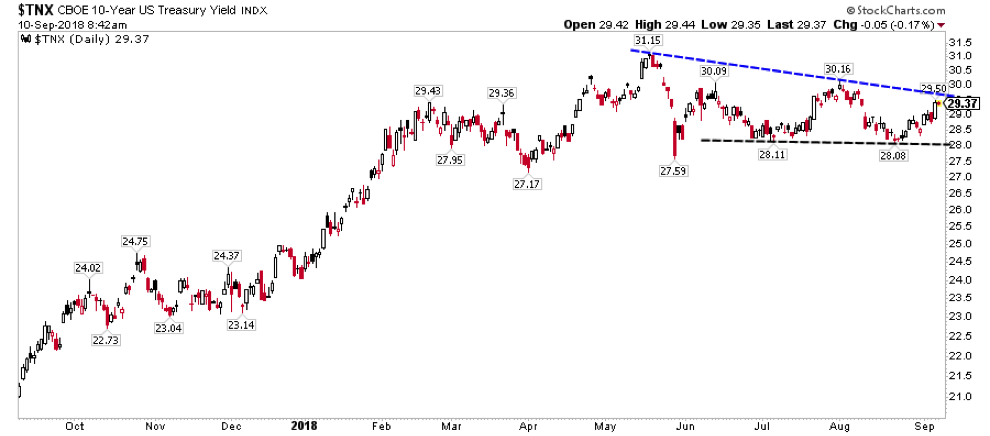
The Ten Year Treasury Yield has also traded in a range most of the year and it has built a platform to move higher. A move over 3.05 or so would be noteworthy.
10 Year US Treasury Bond Yield
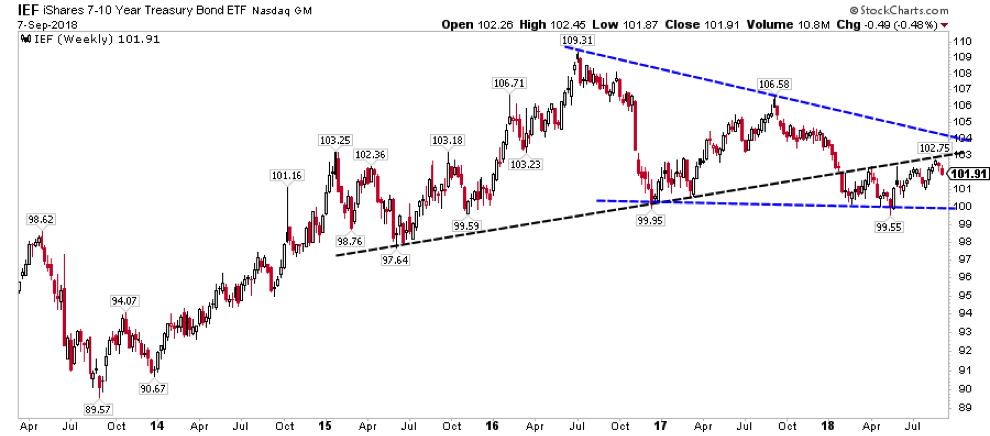
Moving to the Mid-Term Treasury ETF (IEF), a former trend support acting as an upper boundary line. 105 is the level to watch on the upside, 99 on the downside.
$IEF 7-10 Year Treasury ETF
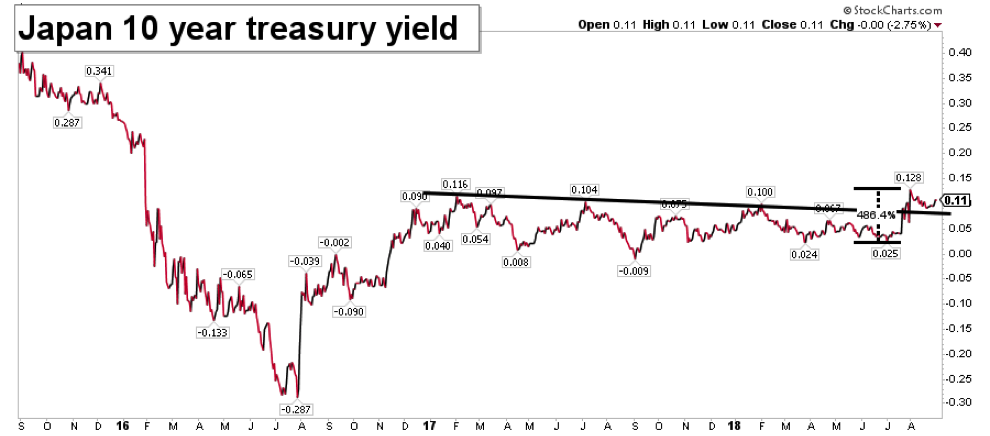
It’s worth noting Japan’s Ten Year Yield has traded in this tight range for nearly 2 years. This has already started to break out of this range
Japanese 10 Year Government Bond Yield
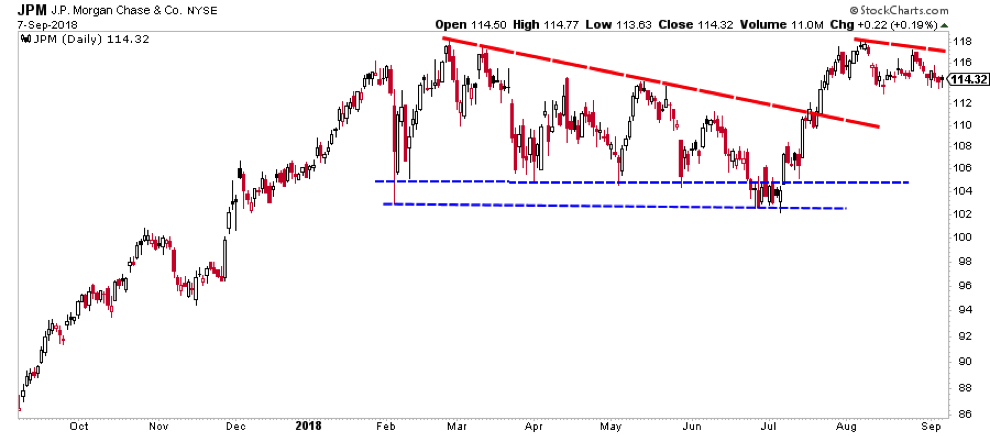
So there is a pretty good chance yields move higher, so how do we play it? For the sake of keeping it simple, JP Morgan.
$JPM has a formed a great base all year and is quitely consolidating at the top of the range.
$JPM JP Morgan Stock Chart
There is a significant pile of evidence suggesting that long term government bond yields could start moving higher soon. Not just higher, but significantly higher with clearly defined risk around 147 in the US Long Bond and 2.80ish in the 10 year treasury yield.
Thanks for reading! Trade ‘em well!
Twitter: @ATMcharts
Any opinions expressed herein are solely those of the author and do not in any way represent the views or opinions of any other person or entity.

: Showing Some Signs of Emerging Strength")
