I’ve been asked a lot of questions regarding Bitcoin (CURRENCY:BTC) by traders, investors, and everyday folks.
My response to them has been, “ask me again in a couple months”.
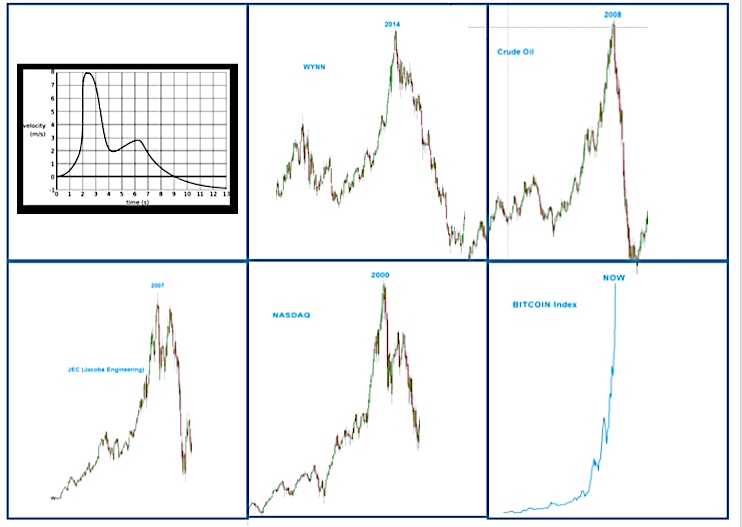
Why? Well, as you can see from the charts below, bitcoin has gone parabolic and it’s anyone guess at how high it can/will go.
That being said, the chart in the top left of the first visual shows you the actual physics behind parabolic moves and what happens (always) with velocity over time. Invariably, it will run out of velocity and then fall like a stone. I’ve included some other depictions side by side of housing, banking, the NASDAQ, Crude Oil, etc. to show you how the pattern is almost exactly the same.
As many of you know, it was my privilege to fly Navy F-14’s for 11 years. For those of you with aviation backgrounds we are ‘bullseye nose high’ in full afterburner. One of three things are going to happen:
- Your thrust to weight ratio will not be able to sustain a continued climb. Result: you will peak and then fall in out of control flight.
- Your thrust to weight being greater than 1:1 will propel you to above 65,000 feet and your cockpit pressurization will crack and, well, you might implode. Ouch.
- None of the first two will happen but, unless your running on solar fuel (to my best knowledge this doesn’t exist), you will run out of gas and, well, fall.
Sir Isaac Newton has yet to be proven wrong.
So caveat Emptor on Bitcoin. Once it falls, start to email me or tweet at me again.
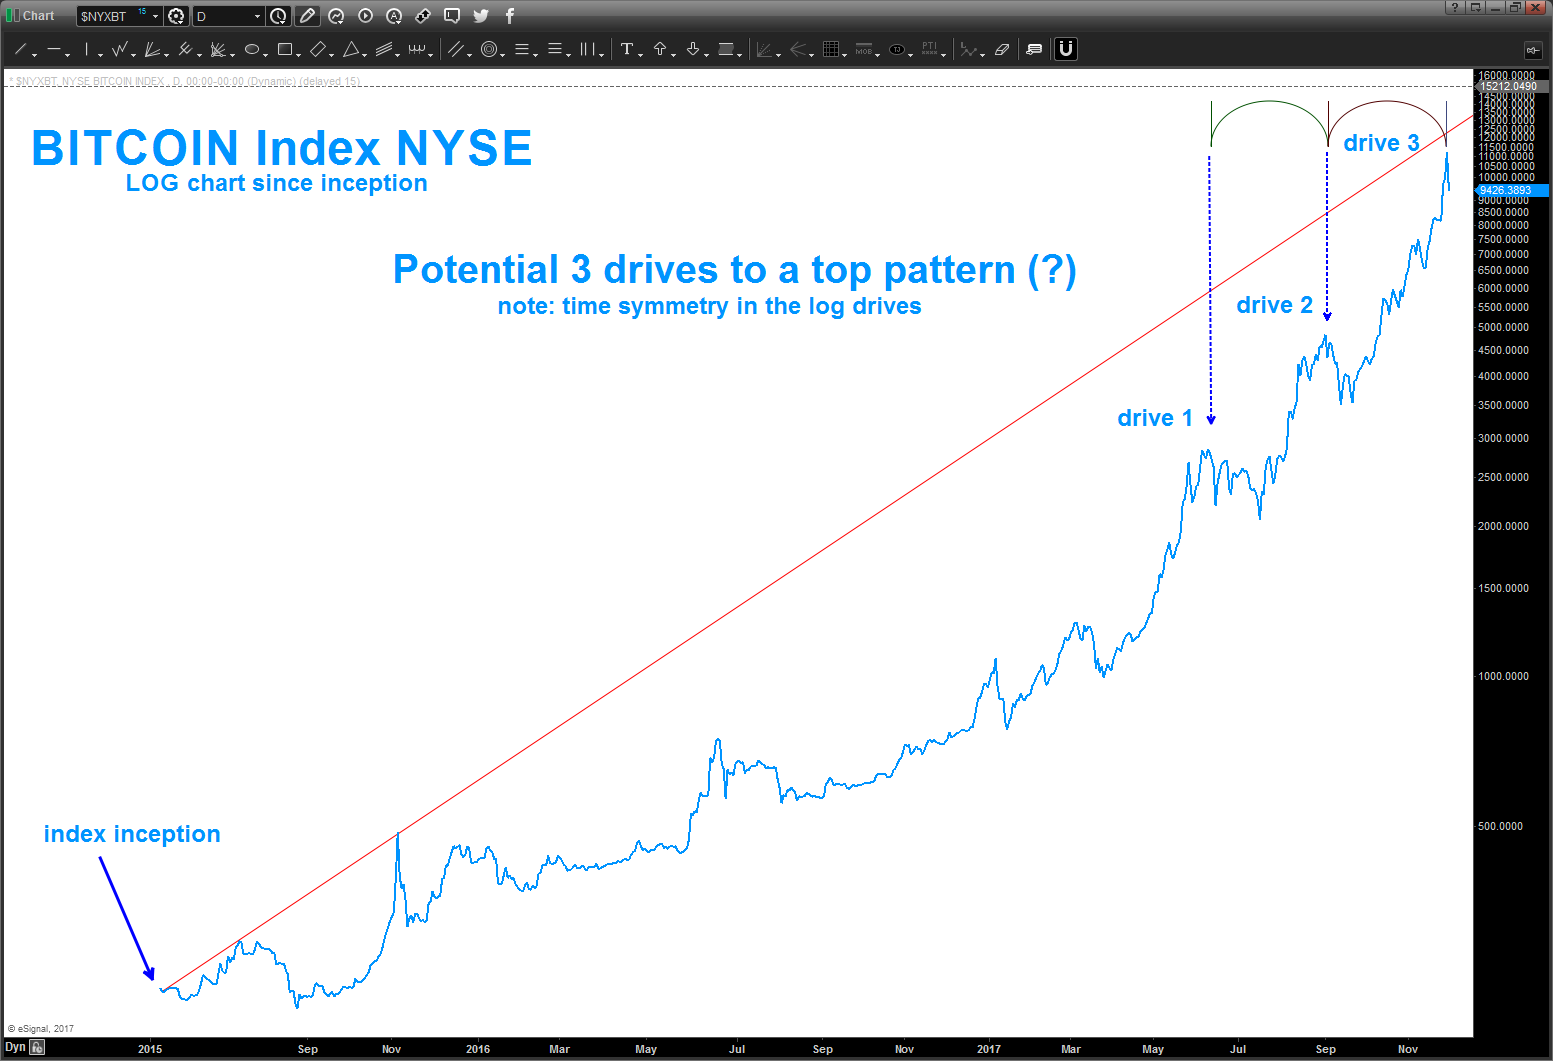
Take note of the LOG time symmetry in the potential 3 drives to a top pattern that is coming into play. Additionally, we have the long term long trend line (red) looming just a little higher also. The parabolic rise might still continue but we are definitely in thin air up here.
Thanks for reading.
Twitter: @BartsCharts
Author does not have a position in mentioned securities at the time of publication. Any opinions expressed herein are solely those of the author, and do not in any way represent the views or opinions of any other person or entity.

: Cup (and Maybe Handle) Watch")
 Trading Near Top Of Price Range")

