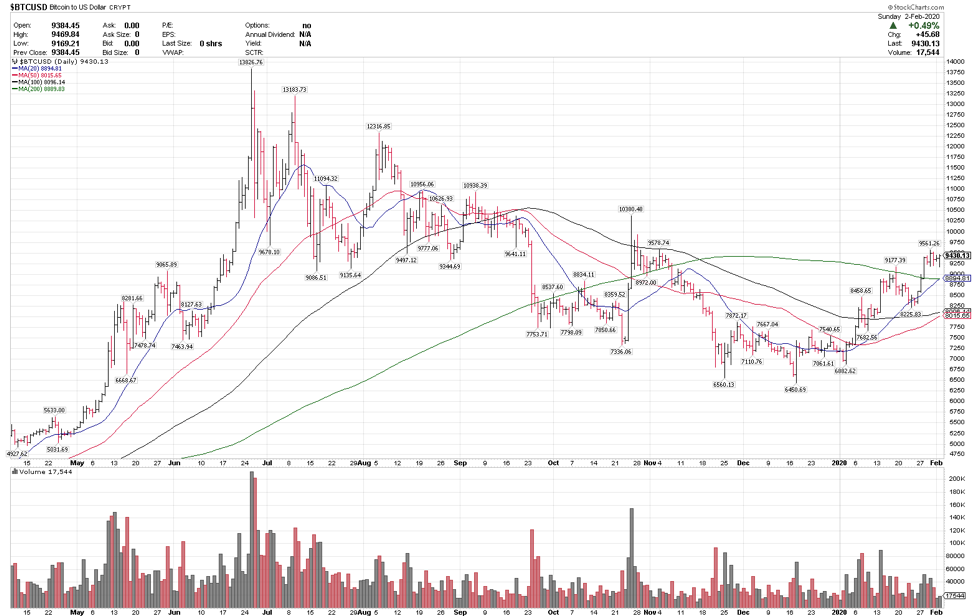
One market that triggered a technical buy signal for us over the last week is Bitcoin $BTCUSD and the ETF OTC:GBTC.
From a technical perspective, BTCUSD has made 4 higher-highs (7540, 8458, 9177, and 9561) and 3 higher-lows (6882, 7682, 8225), since putting in a tradable low in mid-December at 6450.
Other technical buy signals for Bitcoin are the recent closes over $9,000 and over the 200-day moving average, a key long-term trend indicator.
A key support level on any pullbacks is the 7500 – 8000 level.
$BTCUSD Bitcoin Price Chart
The Bitcoin ETF, GBTC is picking up as well, with a recent close over the key $10 level, and back over the 200-day moving average.
Key support here on any pullback is at 8.90, and because this is a more volatile market, I often use wider than average stop losses to avoid getting caught up in shorter term volatility.
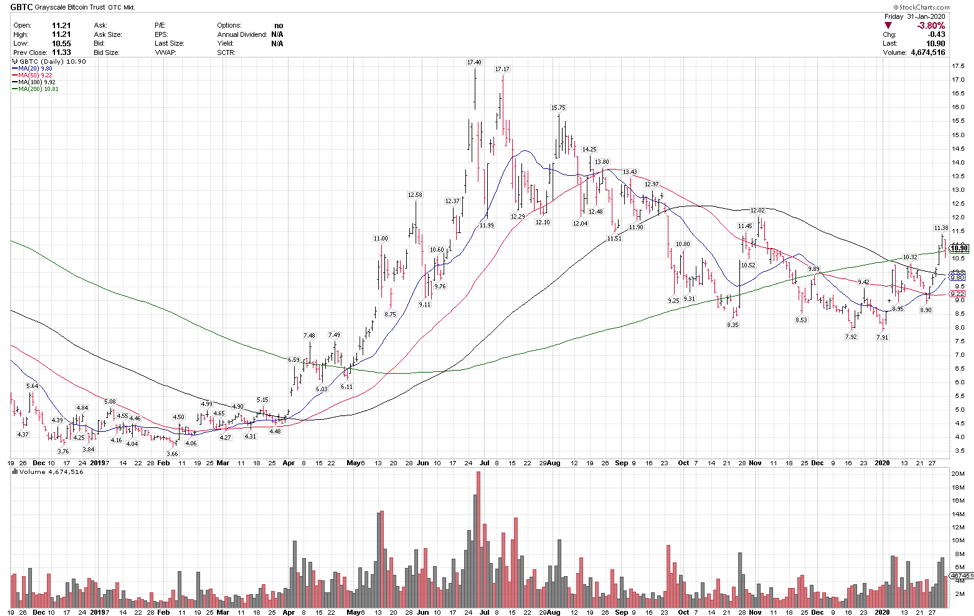
Both $BTC and $GBTC have had impressive run ups recently, and while they may be due for some shorter-term consolidation, the wider stops allow room for the position to work, and the potential reward vs risk math is favorable.
Larry is the publisher of the Blue Chip Daily Trend Report.
Twitter: @LMT978
Any opinions expressed herein are solely those of the author, and do not in any way represent the views or opinions of any other person or entity.

: Worrisome to Broader Market?")

