One of the biggest breakouts of 2020 came by way of Bitcoin. And it was epic.
The coronavirus crash saw the cryptocurrency retest its 2018 lows before rocketing higher in parabolic fashion.
Did Bitcoin Peak? What’s Next?
Today we examine a “weekly” chart of Bitcoin, highlighting its parabolic rally… and recent reversal lower.
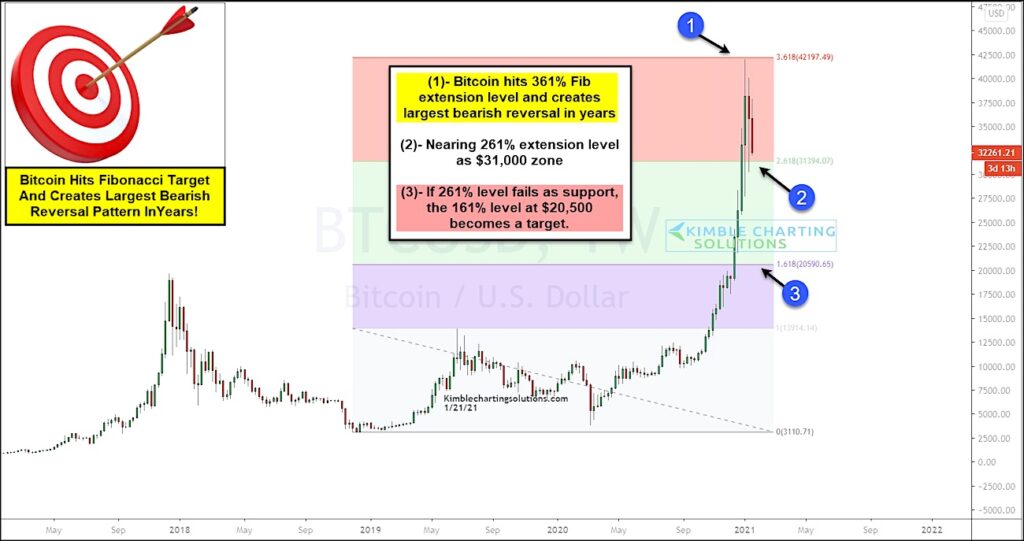
The rally in Bitcoin surged all the way to the 361% Fibonacci extension level at (1) before creating the largest bearish reversal in years.
In just a few weeks time, Bitcoin is testing its 261% Fibonacci level near 31,000 at (2). This is a big test of support for the cryptocurrency. A “weekly” closing below this support level could bring a decline all the way to 20,500 and its 161% Fib level at (3). That would be a full retest of the 2017 highs!
What bitcoin does in the days/weeks ahead will be important for traders. Stay tuned!
Bitcoin “weekly” Chart
Note that KimbleCharting is offering a 2 week Free trial to See It Market readers. Just send me an email to services@kimblechartingsolutions.com for details to get set up.
Twitter: @KimbleCharting
Any opinions expressed herein are solely those of the author, and do not in any way represent the views or opinions of any other person or entity.

 Testing Important Price Support")
: Cup (and Maybe Handle) Watch")

