The bubble up in Bitcoin prices brought a high in late 2017 and its been tough sledding for enthusiasts since.
There are a few different ways to follow Bitcoin prices (Bitcoin, Bitcoin futures, Bitcoin Cash). Today we’ll look at Bitcoin Cash (BCH.USD).
From a trading perspective, traders were recently offered an opportunity to trade Bitcoin Cash on the long side.
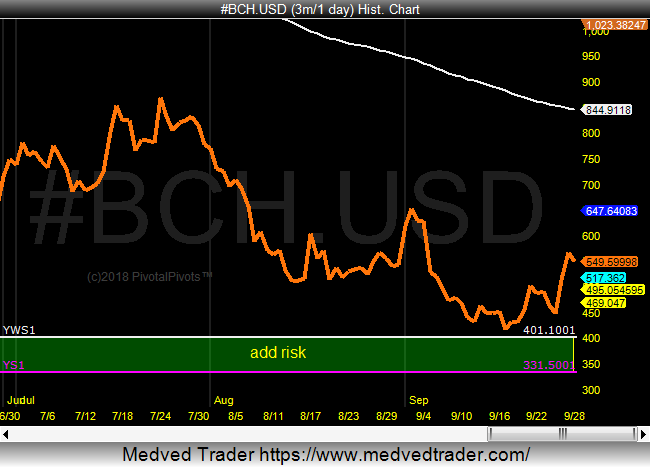
Bitcoin Cash made a high around $4100 in 2017. This year it fell to $417. Ouch!
That said, BCHUSD could be close to making a bottom for 2018 on the Yearly S1 Pivots that sit between $401-$331.
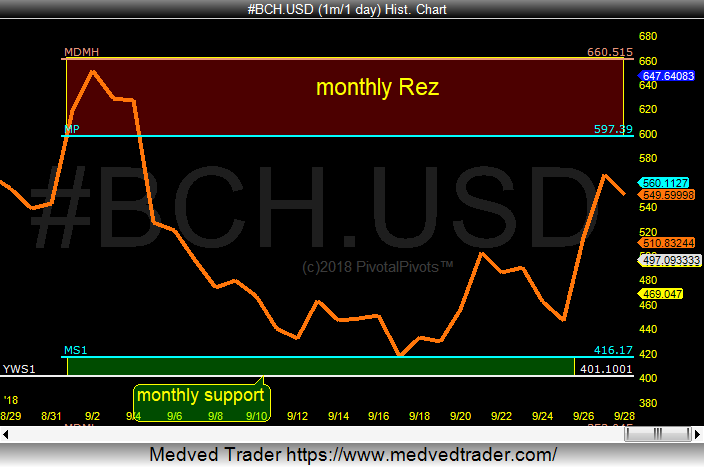
In September, the Monthly S1 Pivot (Ms1) caught the pullback. Looking forward to October, support comes in at $480 with resistance at $666.
Look for my new premium service coming this Fall on twitter @CryptoPivots.
Bitcoin Cash (BTC.USD) Charts
Twitter: @Pivotal_Pivots
The author may have a position in mentioned securities at the time of publication. Any opinions expressed herein are solely those of the author, and do not in any way represent the views or opinions of any other person or entity.


