As stocks continue to climb higher, several lagging sectors are playing catch up.
One such sector is the SPDR Biotech Sector ETF (XBI).
While it IS still lagging on a year-to-date basis, it has caught up considerably. And it is out-performing over the past 2 months.
Today, we highlight guideposts for XBI’s recent up-trend.
Note that the following MarketSurge charts are built with Investors Business Daily’s product suite.
I am an Investors Business Daily (IBD) partner and promote the use of their products. The entire platform offers a good mix of tools, education, and technical and fundamental data.
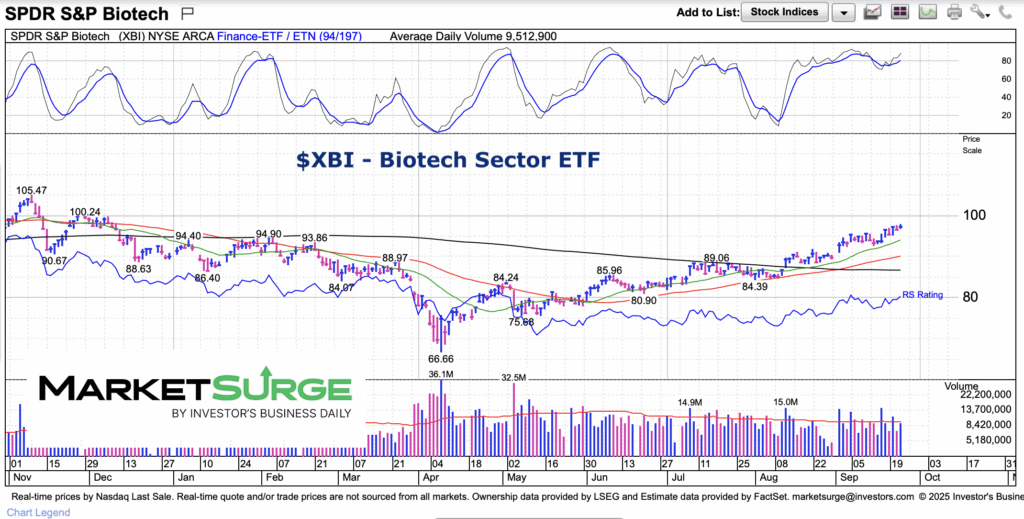
$XBI Biotech Sector ETF Chart
Since the April low, XBI has been in an up-trend. As you can see, the 20/50 day moving averages are both trending higher (and price remains firmly above both). The only concern is that the 200-day moving average is still falling. Bulls want to see the 200-day flatten out and start turning higher.
For now, watch the 20 and 50 day moving averages. If the former fails to hold, then watch the latter.
Twitter: @andrewnyquist
The author may have a position in mentioned securities at the time of publication. Any opinions expressed herein are solely those of the author, and do not in any way represent the views or opinions of any other person or entity.
")

 Front Running Oil Prices")


")
