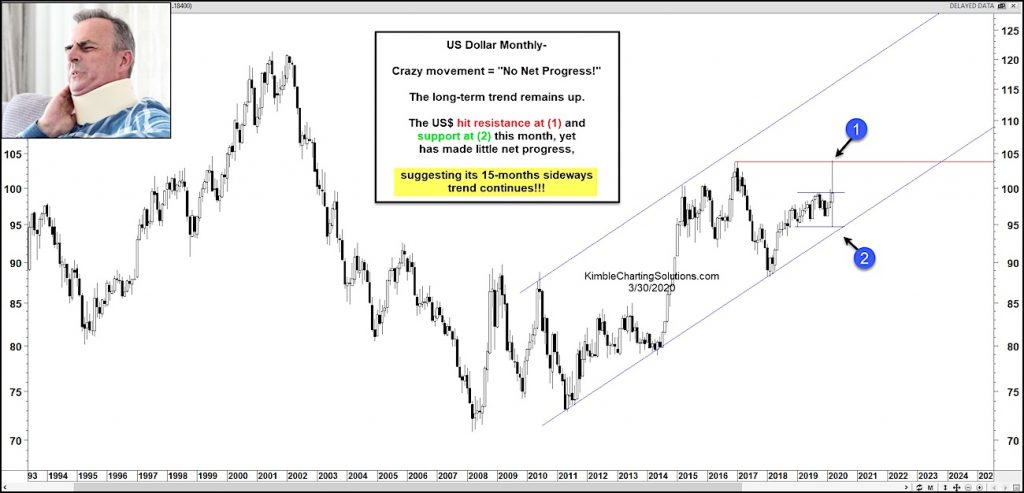
U.S. Dollar Index Monthly Chart
The coronavirus panic has wreaked havoc on global financial markets, including the largest market in the world, the currency market.
Today we look at a long-term “monthly” chart of the U.S. Dollar to highlight just how crazy the price movements have been.
Just this month alone, the U.S. Dollar has tested its multi-year highs (resistance) at 1 as well as it’s long-term rising up-trend (support) at 2.
From low to high, that’s nearly 10 percent! A huge move for King Dollar.
But the crazy fact in all this is that the Dollar has made little to no net progress this month! This suggests that the Dollar may continue to trade sideways for a while. Stay tuned!
Note that KimbleCharting is offering a 2 week Free trial to See It Market readers. Just send me an email to services@kimblechartingsolutions.com for details to get set up.
Twitter: @KimbleCharting
Any opinions expressed herein are solely those of the author, and do not in any way represent the views or opinions of any other person or entity.

 and Semiconductors (SMH): Concerning Price Pattern?")

 and Semiconductors (SMH): Concerning Price Pattern?")


