It was an ugly day for treasury bonds. Let’s recap the recent price action of a popular treasury bonds ETF and look for clues as to the intentions of bonds.
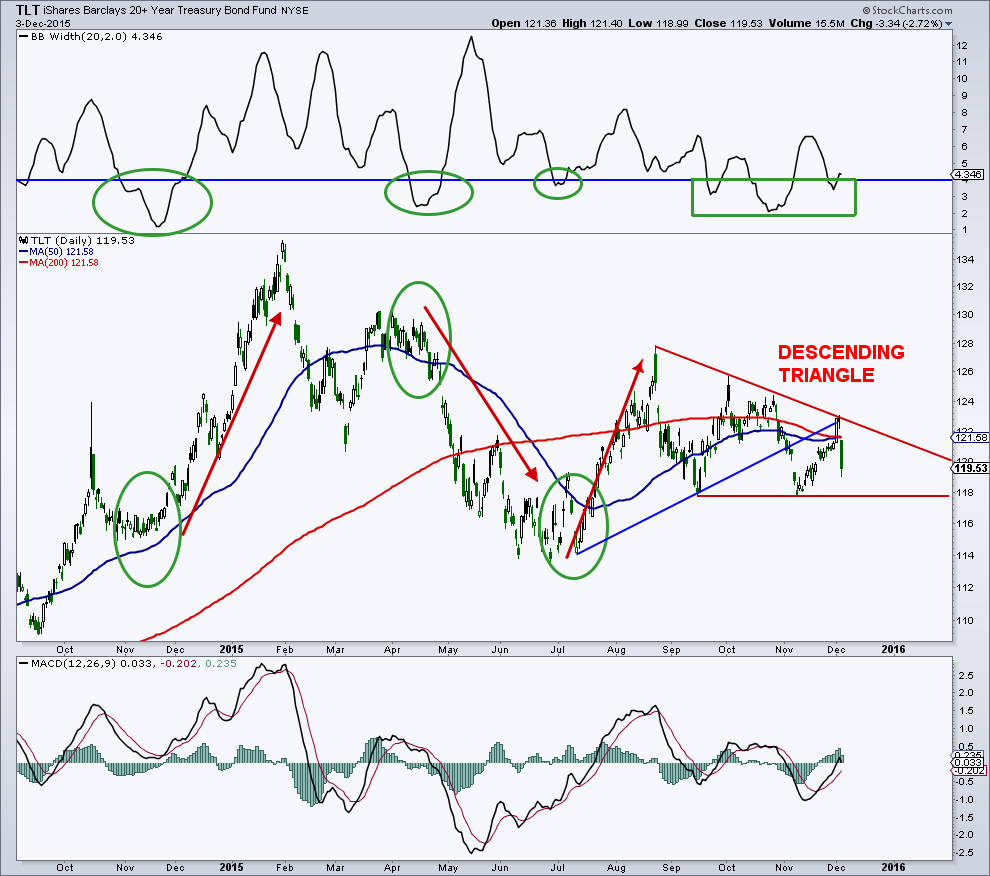
The iShares 20+ year Treasury Bonds ETF (TLT) saw a kick back rally right to broken trendline support (now resistance) and has reversed sharply. It appears that price is tracing out a good-sized, bearish descending triangle. To complete this pattern, TLT needs to break below the bottom of the formation at 118. Based on the size of the pattern of 8 to 10 points, there could be a measured move down to 110 or below.
The treasury bonds ETF (TLT) is under both the 50-day and 200-day moving averages and the longer average is declining.
In addition, there have been a series of 3 Bollinger Band (BB) constrictions under 4% in the past couple of months without a big move yet. Prior BB pinches under 4% have led to big moves, both higher and lower for TLT.
iShares 20+ year Treasury Bonds ETF (TLT) – Daily Chart
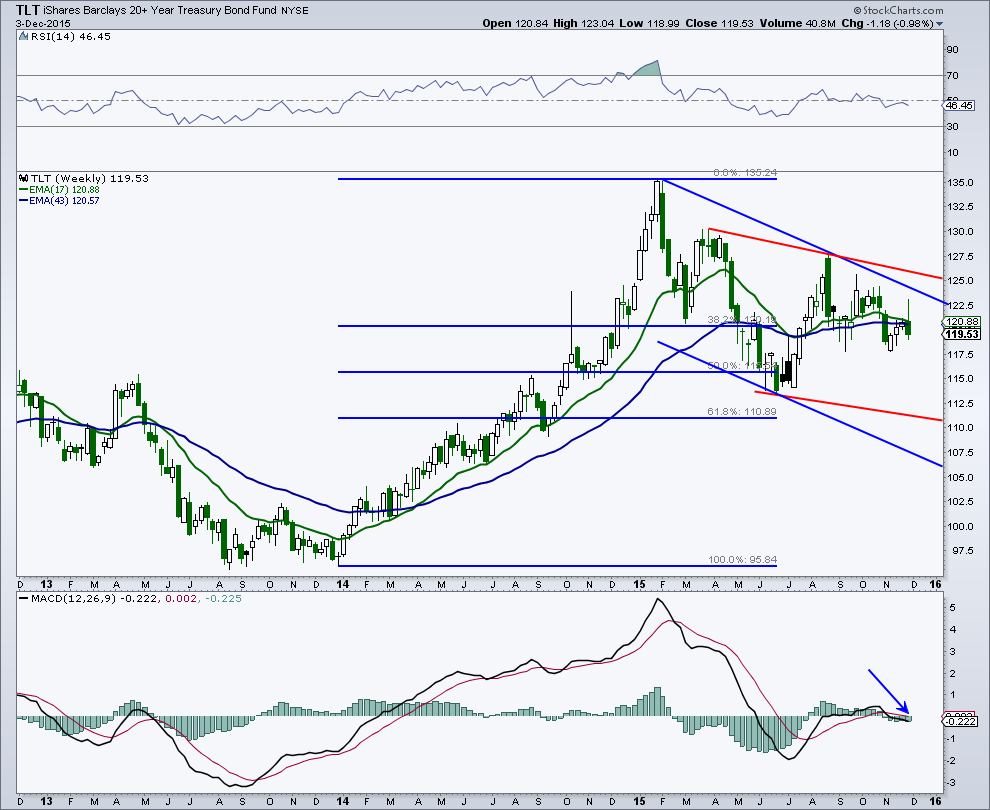
On the weekly chart, both downtrend channels remain intact. The treasury bonds ETF (TLT) fell back below its 17-week and 43-week exponential moving averages and the shorter average is close to breaking below the longer average, which would be the first bearish crossover in 2-1/2 years for TLT. The 14-week RSI is below 50, an intermediate-term warning sign. In addition, the weekly MACD is on a sell signal and in negative territory. This is supportive of a move lower.
iShares 20+ year Treasury Bonds ETF (TLT) – Weekly Chart
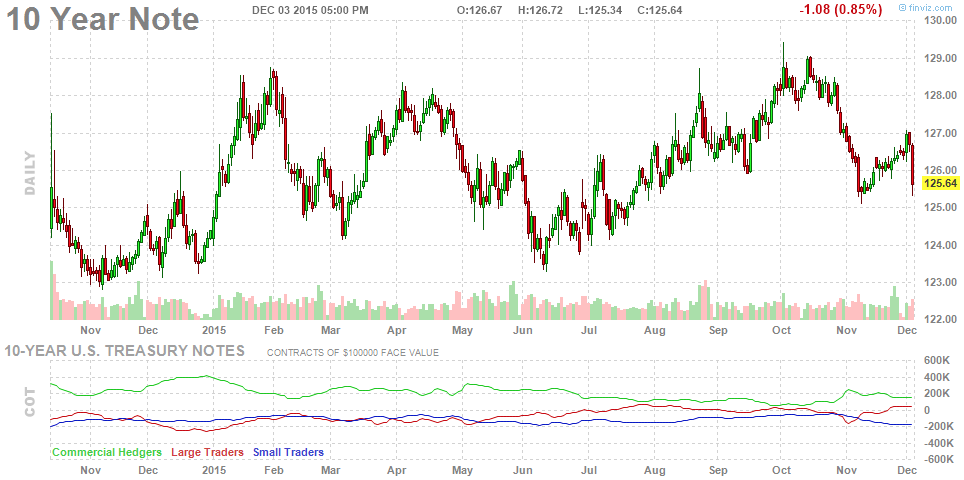
The COT data is bearish for the 10 year note. Since the beginning of November, smart money commercial hedgers have been cutting their net futures positions while dumb money large speculators have been increasing their net futures positions in the 10-year. In addition, commercials have been reducing positions while large specs have been raising positions for all of 2015.
10 Year Treasury Note
In conclusion, I think longer dated treasuries could see a fairly large correction during the better part of 2016.
Thanks for reading and enjoy your weekend.
Twitter: @MarkArbeter
The author does not have a position in any mentioned securities at the time of publication. Any opinions expressed herein are solely those of the author, and do not in any way represent the views or opinions of any other person or entity.


