Home retailer Bed Bath and Beyond (BBBY) tanked by 18% on Thursday morning, after reporting inline earnings.
The company reported earnings per share of $1.48 and total revenue of $3.7 billion, compared to analyst expectations of $1.41 and $3.6 billion.
So what’s the big concern?
While total sales were up compared to the previous quarter, comparable store sales dropped by 0.6%. For this year, management expects minimal sales improvement.
Bed, Bath… and Bye Bye?
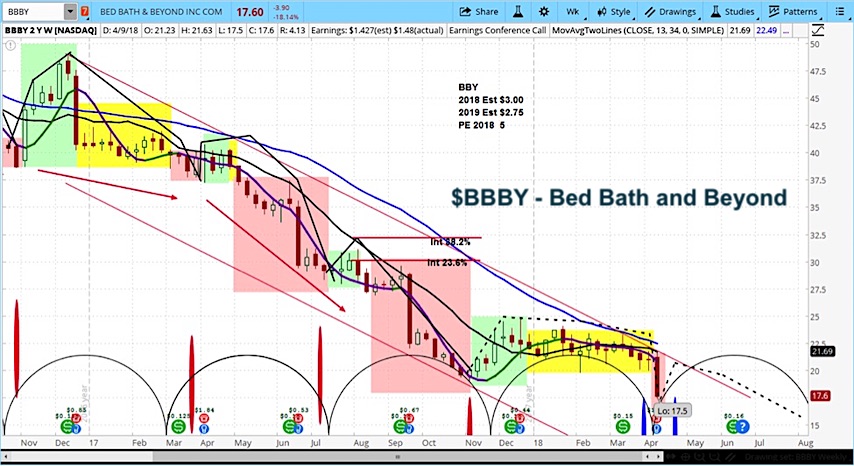
Upon reviewing the BBBY weekly stock chart, we can see that it is now concluding the declining phase of its current market cycle, as illustrated by the semicircles on the bottom. The consistent downtrend from one cycle to the next on this chart is notable. We expect a pop after the next cycle begins but lower prices are certainly possible after that. This one may be in the dog house for the foreseeable future.
Bed Bath and Beyond (BBBY) Stock Chart with Weekly Bars
For an introduction to cycle analysis, check out our Stock Market Cycles video.
Twitter: @askslim
The author may have a position in mentioned securities at the time of publication. Any opinions expressed herein are solely those of the author, and do not in any way represent the views or opinions of any other person or entity.


