Are the Homebuilders experiencing a case of Deja Vu?
Is it 2006 all over again?
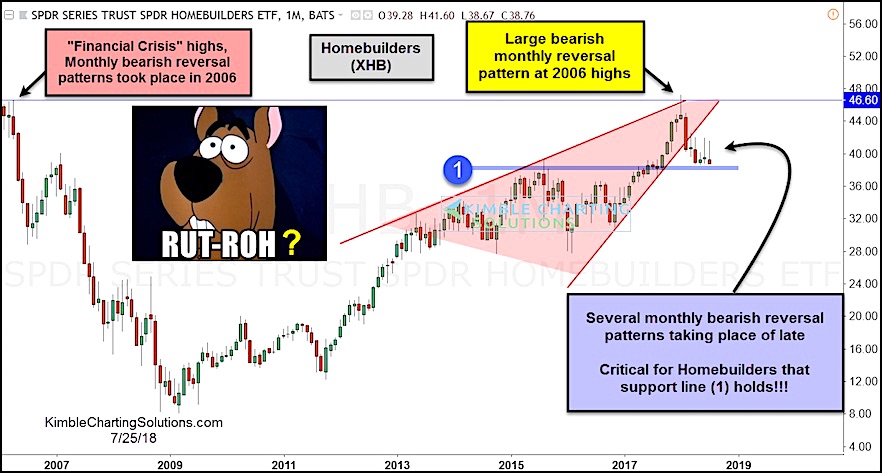
Looking at a monthly chart of the Homebuilders ETF (NYSEARCA: XHB), you can see that a series of bearish reversals took shape back in 2006, just prior to the financial crisis.
Fast forward to 2018 and we see something similar. It all started with a large bearish reversal candle in January… and we’ve seen several bearish reversal wicks since.
The Homebuilders are now testing important horizontal support at point (1).
Considering the downside ramifications (and broader market implications), it is critical that bulls hold this support line!!
Homebuilders ETF (XHB) “Monthly” Chart
Note that KimbleCharting is offering a 30 day Free trial to See It Market readers. Just send me an email to services@kimblechartingsolutions.com for details to get set up.
Twitter: @KimbleCharting
Any opinions expressed herein are solely those of the author, and do not in any way represent the views or opinions of any other person or entity.


