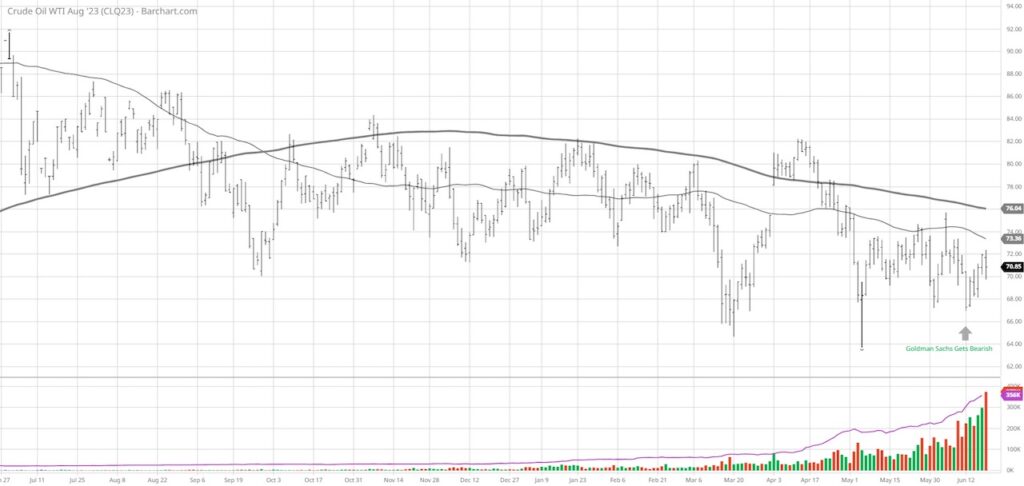
Crude Oil Futures
On June 12th, Goldman Sachs came out with this:
Goldman Sachs has slashed its forecast for oil prices by nearly 10%, citing weak demand in China and a glut of supply from sanctioned countries, including Russia.
What the big institutional analysts have done this year, is get pretty much everything wrong.
I pick on Goldman today because our view on oil-somewhat fundamental and somewhat technical is so very different than theirs.
Plus, the prediction came out on the low tick for the last week.
Goldman claimed support for their viewpoint on the basis of
- Restored Russian supply and their using secret tankers to get oil delivered globally
- China’s real estate market leading to low demand for oil in a struggling economy
- Saudi’s attempt to shore up price with lower production
We look at those points differently.
Russia (Putin) may get more desperate and escalate the war thereby threatening supply chain.
China is stimulating their economy and demand for oil is increasing.
Saudi has proven that they wish to keep prices up-leaving supply/demand vulnerable.
The charts help us as well.
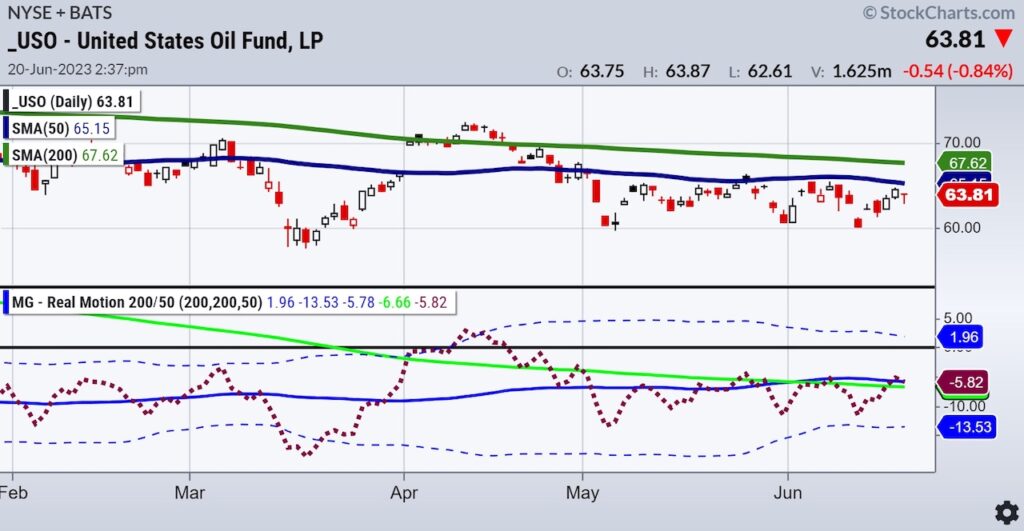
The US Oil fund is not futures. The fund predominantly holds near-month-futures contracts on WTI, rolling into future contracts every month.
It also has exposure to the U.S. Dollar (53.63%) so not perfect like futures.
Nonetheless, the ETF is highly liquid.
On the futures chart above, the price is approaching the 50-DMA with a declining slope. Over the 200-dma (thicker line) or price of $76, this heavily shorted raw material could fly.
On the USO chart, the price remains under the 50-DMA as well. Over 65, the chart gets more interesting.
Over 68, we can make a case for a bottoming formation that goes back to March. That could take USO up to around 78 or in futures to around $100.
Real Motion has a bullish divergence!
The momentum is indicating a bullish phase above both the 50 and 200-DMAs which are stacked appropriately.
A move under 60, all bets are off.
However, we are going with a move higher in oil forthcoming-
And yet another example of learning how to make trading decisions on your own, ignoring the “smart” analysts.
Stock Market ETFs Trading Analysis & Summary
S&P 500 (SPY) 440 pivotal with potential reversal-has to break under 434
Russell 2000 (IWM) 180-190 stuck
Dow (DIA) 34,000 in the Dow now pivotal
Nasdaq (QQQ) 370 target hit proceeded by some selling-360 support
Regional banks (KRE) 42 support, 44 pivotal
Semiconductors (SMH) 150 now major support.
Transportation (IYT) 237 area the 23-month moving average
Biotechnology (IBB) 121-135 range
Retail (XRT) 62 support and if clears back over 63, optimism returns
Twitter: @marketminute
The author may have a position in mentioned securities at the time of publication. Any opinions expressed herein are solely those of the author and do not represent the views or opinions of any other person or entity.


