The bear market rally off the March 23 stock market crash lows has been uneven, to say the least.
On the surface, it appears that the market recovery is in full swing.
BUT it really depends on where you are invested.
Today’s charts are simple, but they tell a story. A healthy economy and market tends to have both large caps and small caps participating. It also tends to have transportation and financials involved. No, they do not all have to be leaders. But the degree of lagging shouldn’t be as glaring as we are seeing now. So what do we make of this?
Note that the following MarketSmith charts are built with Investors Business Daily’s product suite.
I am an Investors Business Daily (IBD) partner and promote the use of their products. The entire platform offers a good mix of technical and fundamental data and education.
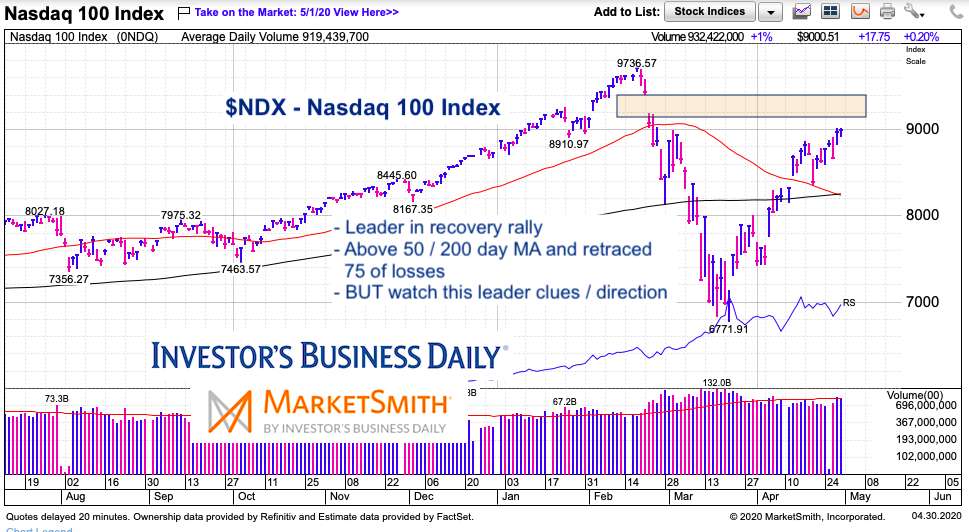
Nasdaq 100 Index Chart
Our first chart highlights our market leader: tech stocks. As you can see, a strong recovery off the March crash lows. This leader is near resistance so caution is advised.
BUT, for the purpose of this exercise (to show leaders vs laggards), this is a leader.
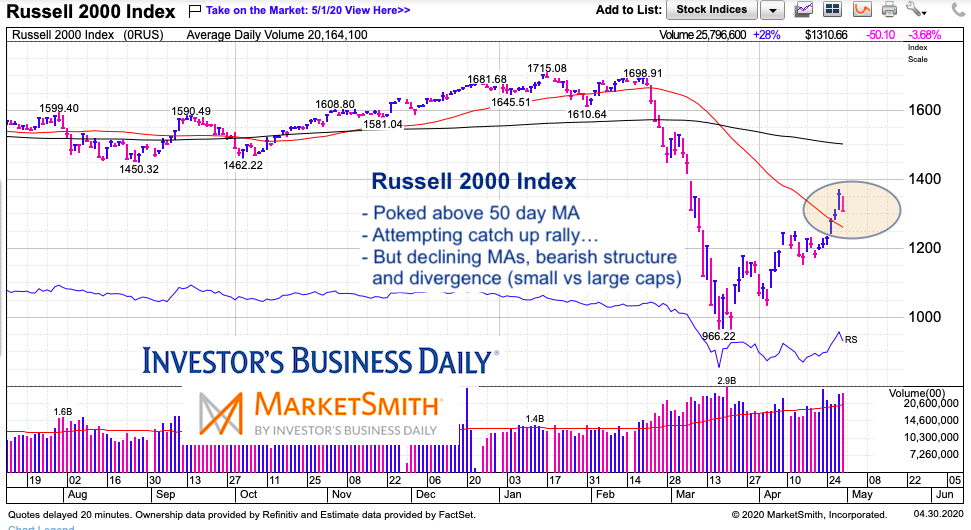
Russell 2000 Index Chart
Okay, so here’s our first laggard. Small caps have struggled versus the favored large caps.
A poke above the falling 50 day MA may be fleeting if bulls don’t see follow-through buying.
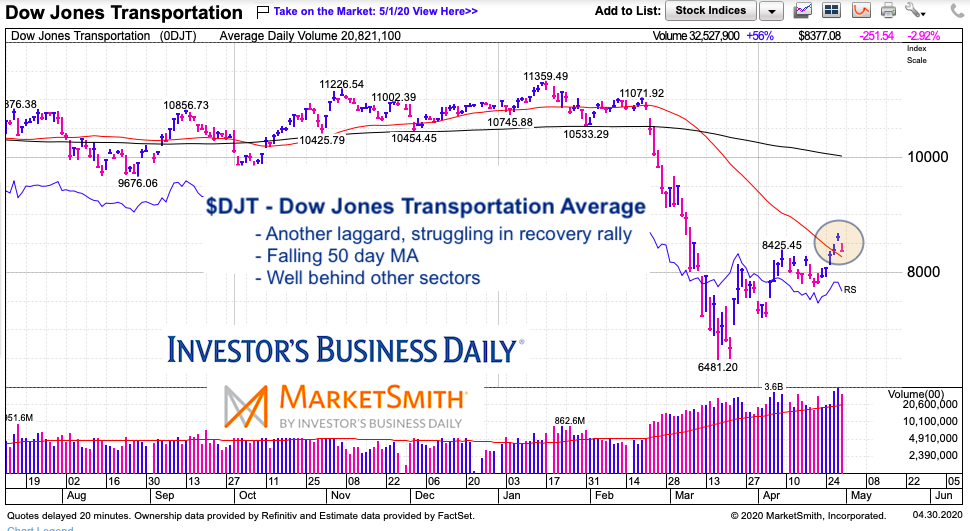
Dow Jones Transportation Average Chart
Yet another important sector lagging the rest of the market. Not good for bulls.
The transports have been killed by the economic shutdown and it’s showing…
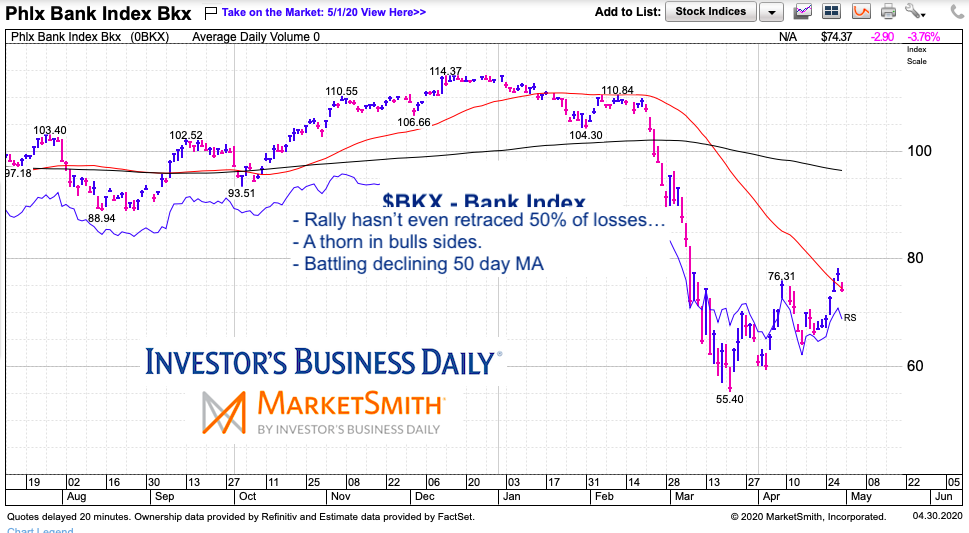
BKX Bank Index Chart
Banks. Bulls need them too. But they are struggling… and lagging.
The Bank Index is trading near its falling 50 day MA. Though a breakout over the 50 day MA would be short-term bullish and give the market a boost, just look at how far behind the banks are. Not a good look.
Twitter: @andrewnyquist
The author may have a position in mentioned securities at the time of publication. Any opinions expressed herein are solely those of the author, and do not in any way represent the views or opinions of any other person or entity.

: Showing Some Signs of Emerging Strength")
