Bank stocks perked up last year, catching a tailwind from rising interest rates.
The sector remains in an intermediate-term uptrend, but momentum has stalled out at an important price level. And investors should pay attention here.
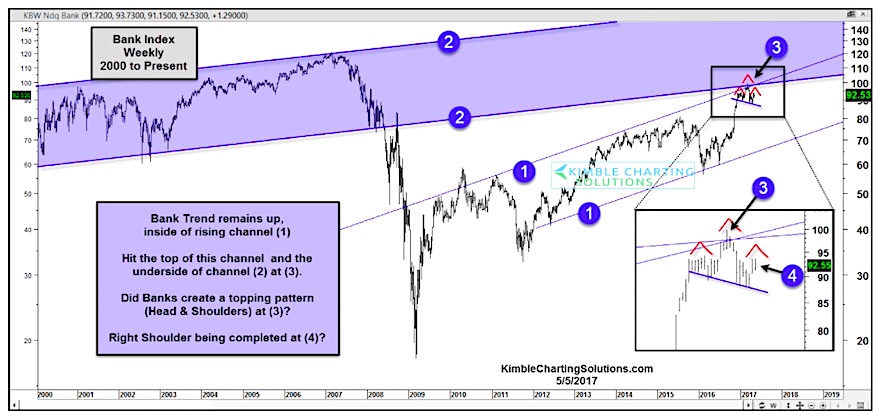
The chart below is of the KBW Bank Index (INDEXNASDAQ:BKX) since 2000. You can see that the most recent rally began after testing its rising trend line off the 2011 lows, holding within its rising uptrend channel (Point 1).
But the Bank Index has stalled out at a convergence of price resistance (marked by the top of its current rising channel and the underside of its old channel – Point 2).
There’s more… something else that active investors should be paying attention to. Might the Bank Index be tracing out a “head and shoulders” topping pattern (Point 3)? That depends on one remaining detail: the completion of a right shoulder at Point 4.
What happens here could change the complexion of investing portfolios. A strong turn lower that breaks the blue neckline (in the box of point 3) of this pattern would bearish for bank stocks. And on the flip side, a move to near multi-year highs would be bullish for the banks. Stay tuned!
Bank Index Weekly Chart (2000 to present)
Thanks for reading and have a great week!
ALSO READ: Can Commodities Rally Back From The Depths?
Twitter: @KimbleCharting
Any opinions expressed herein are solely those of the author, and do not in any way represent the views or opinions of any other person or entity.


 Ready To Break Out?")