August was an eventful month on the political and economic front, as concerns about the European economy joined the headlines along with the continued expansion of U.S. involvement in Syria and Iraq. The financial markets continued to revolve around the Federal Reserve and any indications that they might behave differently than planned. At the same time, stocks drifted slightly lower along with bonds, while the US Dollar continued to rise.
Here is what happened in the financial markets, by the numbers:
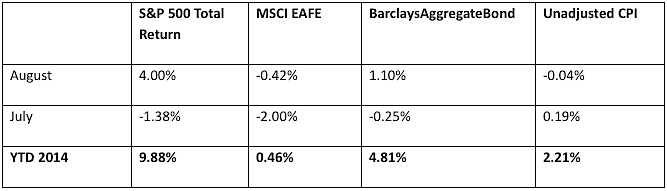
Stocks & Bonds
In August Mario Draghi, head of the European Central Bank, announced additional money printing, driving the euro lower and sending the dollar to a 14-month high. U.S. equity and credit markets both benefited. Inflation has jumped a bit in the last few months, although its annualized adjusted rate is still well within Fed parameters. The table below provides key performance metrics within the financial markets for the S&P 500, Emerging Markets, and inflation data:
Commodities & Currencies
NYMEX Crude Oil prices declined slightly in August, from $97.32 to $95.96 per barrel. Gold prices were almost unchanged at $1,287.40 per ounce, holding on to a 3% gain year-to-date. As central banks weaken currencies around the world, the US Dollar suddenly is the least weak currency, and the financial markets are taking note. On a trade-weighted basis the Dollar gained 1.55% in August, and is now showing a gain of almost 3% year-to-date. A stronger dollar generally puts downward pressure on commodity prices, and many commodities have seen price declines this year. Iron ore, the primary component of steelmaking, is down about 38% year to date, boosting the fortunes of large and efficient mining operations in Australia. These gains have come at the expense of many smaller and less efficient mines in China and Brazil.
Economy
The Labor Department reported that CPI declined 0.2% in August, and has increased only 1.7% over the last 12 months. The Federal Reserve targets an inflation rate of 2%, so there is still no sign of inflation. Indeed, the Fed actually tracks a slightly different measure of inflation than the CPI, which is running even lower than 1.7%.
The unemployment rate ticked back down ever so slightly to 6.1% in August, from 6.2% in July. Employers added only 142,000 jobs, and the rate fell primarily due to discouraged workers leaving the workforce entirely. Moreover, wage gains are barely keeping up with increases costs of goods and services. For many Americans, the recovery exists primarily through articles in the newspaper telling them that we are having an economic recovery.
The Institute for Supply Management had continued good news, reporting that the manufacturing PMI in August was at 59, up 1.9 from July’s 57.1. A reading above 50 indicated economic expansion. As economic indicators in Europe and Japan point to slowing activity, economic data from the U.S. continues to be positive.
The National Association of Realtors releases data on existing home sales for the month of August next week, and this data will be included in our next monthly economic update.
Financial Markets Summary
The economic recovery is continuing, but shows signs of wear. Last week the People’s Bank of China, printed 500 billion yuan ($81 billion) and distributed it to the largest 5 banks in China to forestall a liquidity concern. This is not the first time in the last 12 months that the PBOC has intervened in the Chinese credit markets to deal with liquidity problems. As China’s growth has been a significant part of the global recovery, any slowdown there would have global consequences and reverberate throughout the financial markets. The European Central Bank has also been on a program of ad hoc money printing, while the Bank of Japan has been on an outright mission to print yen in an attempt to finally reverse years of deflation.
These central banks are responding to real problems. Speculation abounds as to China’s true GDP rate, as the official government number reports growth of around 7%, but power generation dropped 2.2% in August which is not necessarily indicative of a growing economy. Japan recently enacted a sales tax hike to try to quell years of government deficit. In response, their GDP declined 7.1% on an annualized basis in the 2nd quarter. GDP in Germany declined 0.2% in the 2nd quarter, and the euro zone as a whole grew only 0.2% for the 2nd quarter, pacing 1.2% for the year.
So the U.S. GDP growth of over 2% looks strangely robust, and the U.S. also stands relatively alone as its money printing program will conclude as planned next month. This looks relatively bullish for the U.S. dollar, which is often bullish for U.S. Treasuries and sometimes so for U.S. equities. I am mildly optimistic for the American recovery, but 2% GDP growth and slack wage growth is hardly a reason to celebrate. The slowing economies around us, if uncorrected, could certainly throw a wrench into the works here at home.
This material was prepared by Greg Naylor, and does not necessarily represent the views of Woodbury Financial or its affiliates. This information should not be construed as investment, tax or legal advice and may not be relied upon for the purpose of avoiding any Federal tax liability. This is not a solicitation or recommendation to purchase or sell any investment or insurance product or service, and should not be relied upon as such. The S&P500, MSCI EAFE and Barclays Aggregate Bond Index are indexes. It is not possible to invest directly in an index.
Investing involves risks and investors may incur a profit or a loss. Past performance is not an indication of future results. There is no guarantee that a diversified portfolio will outperform a non-diversified portfolio in any given market environment. No investment strategy can guarantee a profit or protect against loss in periods of declining values.
Data Sources:
www.standardandpoors.com – S&P 500 information
www.msci.com – MSCI EAFE information
www.barcap.com – Barclays Aggregate Bond information
www.bloomberg.com – U.S. Dollar & commodities performance
www.realtor.org – Housing market data
www.bea.gov – GDP numbers
www.bls.gov – CPI and unemployment numbers
www.commerce.gov – Consumer spending data
www.napm.org – PMI numbers
www.bigcharts.com – NYMEX crude prices, gold and other commodities
https://data.bls.gov/timeseries/LNS11300000 – Labor participation data
https://www.bloomberg.com/news/2014-09-09/csn-and-gerdau-seen-by-goldman-losing-in-iron-ore-rout.html – Iron ore price data and mining commentary
https://www.japantimes.co.jp/news/2014/09/08/business/economy-business/gdp-contraction-revised-to-deeper-than-estimated-7-1/ – Japan GDP data
https://news.xinhuanet.com/english/business/2014-09/05/c_133624217.htm – Euro zone GDP data
https://in.reuters.com/article/2014/09/17/china-power-consumption-idINL3N0RI0OH20140917 – China electricity consumption data
Any opinions expressed herein are solely those of the author, and do not in any way represent the views or opinions of any other person or entity.

: Worrisome to Broader Market?")

