Last month I proposed the hypothesis that behind the divergent signals we’ve been seeing in the market are retail investors (small business owners and middle class), who did not participate in much of the great 2013 uptrend. In recent months, social media has attempted to reconcile the buoyant equities market with an uneven economic landscape. I would like to take this another step further and look at what the flow of money in equities is telling us.
First, it is important to differentiate between the business cycle (3-4 years) and the larger secular cycle (decades) to make sense of some of the seemingly divergent signals offered by the market. To be clear, the market can be bearish within one while bullish within the other.
Last fall, I highlighted how anemic wage growth was not playing into the expectations of the Great Rotation, and those of us who follow macro themes noted earlier this year that we expected the market to move into the latter stages of the business cycle. Fast forward to today and it appears that this macro outlook is receiving confirmation; utilities have trended for months and 1st quarter GDP was negative. That said, the uneven economic recovery has not matched the acceleration of the equities market (old news by now), and this has kept retail investors on the sidelines.
 Putting aside what we may perceive in the near term, let’s take a look again at what the market is telling us about its collective expectations further down road.
Money is flowing into the asset management industry and this may be reflecting the impending return of retail investors.
Retail investors missed out on much of the equities market uptrend of the past couple years. And this is reflected in lower market volumes. But this may be changing, if we can believe what we are seeing in some of the following mid-cap asset management firms: SEI Investments (SEIC), Apollo Investments (AINV), Affiliated Managers Group (AMG), and Eaton Vance (EV).
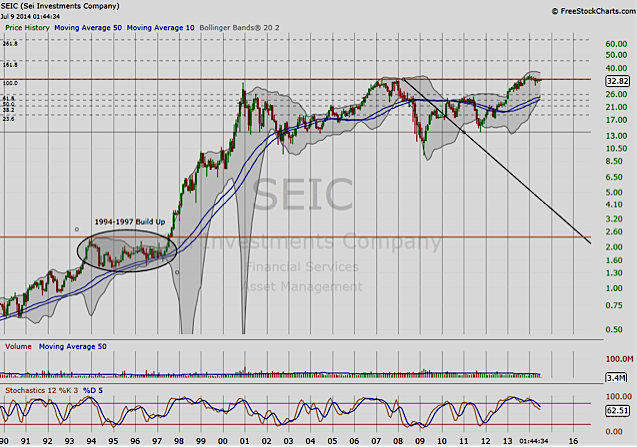
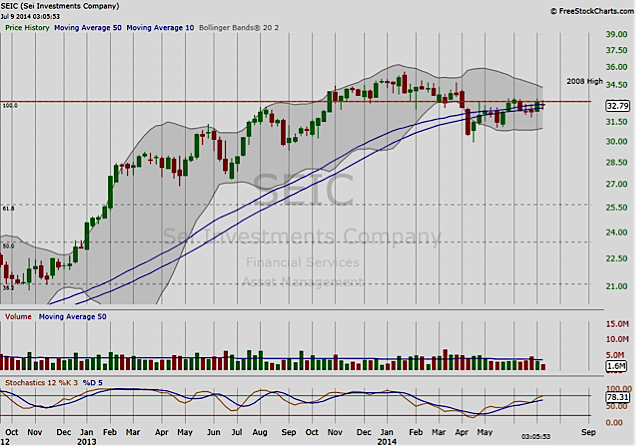
Take for example SEI Investments (SEIC). Below are the monthly and weekly charts for SEIC respectively. Notice the decades-long chart for SEIC closely parallels the SPX. And only just now is it back at its all-time high. Zooming in a bit, the weekly chart highlights that it has been trading in a tight range in recent weeks along its 10/50 week moving average. The price pattern has formed a deep cup since finding a peak earlier this year – a bullish basing formation. Note that a similar theme emerges when studying the charts of the others in this group. I believe this means the market is expecting the middle class to begin investing again, and therefore is demonstrating a bullish long-term view despite what we may see over the near-term. Thank you for reading.
SEI Investments Company – Monthly Chart
SEI Investments Company – Weekly Chart
No position in any of the mentioned securities at the time of publication. Any opinions expressed herein are solely those of the author, and do not in any way represent the views or opinions of any other person or entity.


 Showing Bullish Buy Potential")


