The treasury bond market continues to captivate the minds of active investors as the focus on interest rates (and the Federal Reserve) continues.
If bonds are heading lower, bond yields (interest rates) are heading higher.
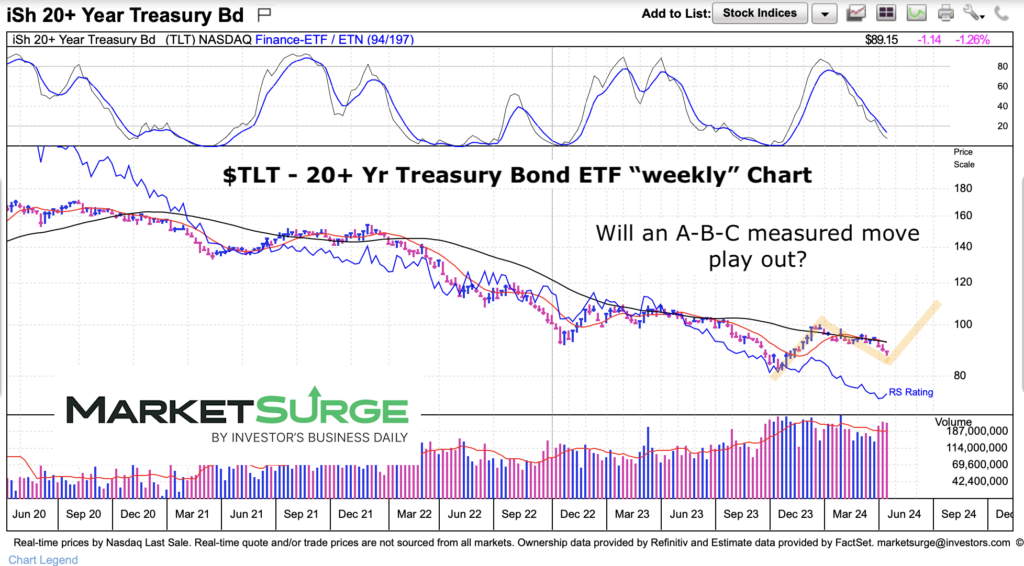
So today we look at a “weekly” chart of the long-dated treasury bonds ETF (TLT). While there are several options for what’s next for treasury bonds, I want to call attention to a simple corrective pattern that could play out.
After a long and steady decline, perhaps treasury bonds are due for a more substantial bounce. And this could show up in the form of an A-B-C corrective pattern.
Note that the following MarketSurge charts are built with Investors Business Daily’s product suite.
I am an Investors Business Daily (IBD) partner and promote the use of their products. The entire platform offers a good mix of tools, education, and technical and fundamental data.
$TLT 20+ Year Treasury Bond “weekly” Chart
There’s really nothing to this other than being aware that many counter-trend pattern show up in the form of an A-B-C bounce. And should treasuries hold above its prior low and begin to rally, this could play out. Again, more of an idea to be mindful of going forward… especially as the stock market has become very interest rate sensitive lately.
Twitter: @andrewnyquist
The author may have a position in mentioned securities at the time of publication. Any opinions expressed herein are solely those of the author, and do not in any way represent the views or opinions of any other person or entity.

: Showing Some Signs of Emerging Strength")
