This year has seen volatility rise across most asset classes, including US Treasury Bonds. More important, though, is that treasury bonds may be forming a long term top.
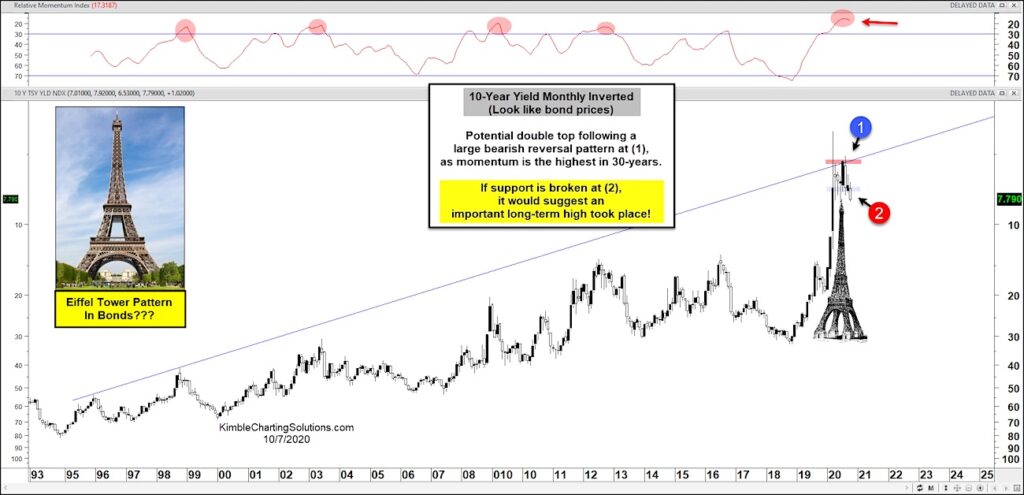
In today’s chart, we look at the yield on the 10-Year US Treasury Bond, but we display it on an inverted (turned upside down) chart so it looks like bond prices. As I have said many times, active investors can eliminate biases by flipping charts upside down. You can read about ways to reduce investor bias by “standing on your head” (2014 article) and similarly by “flipping charts upside down” (2015 article).
As you can see in today’s “monthly” chart, the largest reversal pattern in treasury bond history took place in March during the onset of coronavirus. This occurred as bonds were kissing the underside of a 25-year resistance line.
Treasury bonds tested this resistance again 90-days ago at (1), just as momentum recorded its most overbought reading in the past 30-years. This has formed a potential Eiffel Tower pattern were reversals can happen very fast.
If support breaks at (2), look for lower treasury bond prices and higher bond yields!
Is the 40-year treasury bond bull market over? Still early in the game, but patterns are moving in that direction. Stay tuned!
Note that KimbleCharting is offering a 2 week Free trial to See It Market readers. Just send me an email to services@kimblechartingsolutions.com for details to get set up.
Twitter: @KimbleCharting
Any opinions expressed herein are solely those of the author, and do not in any way represent the views or opinions of any other person or entity.


