The initial coronavirus market panic sent treasury bonds soaring. But since that panic move, treasury bonds have reversed lower.
Today’s “monthly” chart of long-dated treasury bonds (using the ETF $TLT) highlights this reversal of fortune for bond investors.
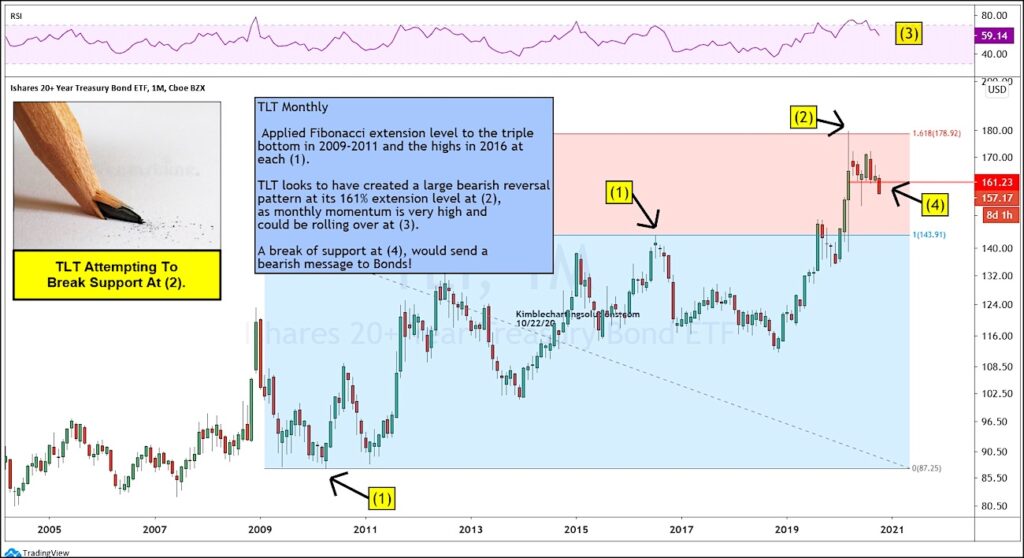
Using the triple bottom formed in 2009 – 2011 and the high in 2016 – marked by each (1) – we can project the 161.8% Fibonacci extension level at (2). Note that the coronavirus panic pushed bonds all the way up to that level before reversing lower intra-month and forming a bearish reversal pattern. This has lead to further weakness and comes at the same time that momentum is rolling over at (3).
Are treasury bonds receiving bearish confirmation the month? The October “monthly” candle for $TLT is long and red… and potentially breaking below important support at (4). A break of support would send a bearish message to bonds. Stay tuned!
Note that KimbleCharting is offering a 2 week Free trial to See It Market readers. Just send me an email to services@kimblechartingsolutions.com for details to get set up.
Twitter: @KimbleCharting
Any opinions expressed herein are solely those of the author, and do not in any way represent the views or opinions of any other person or entity.


