Weakness in the technology sector continues to rattle the markets as growth stocks get hit.
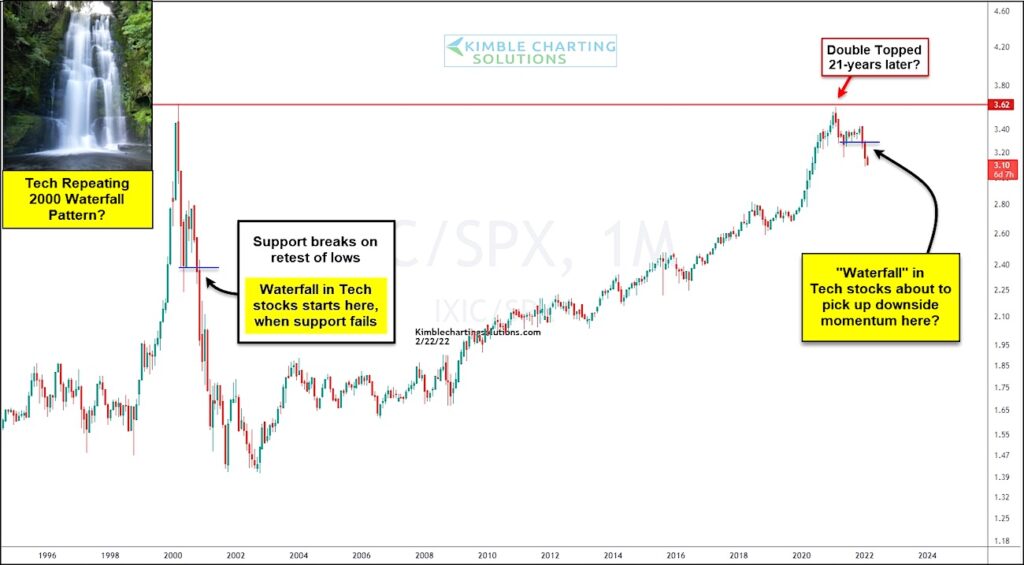
Today we take a look at the relative strength (or lack there of) of the Nasdaq Composite by looking at its ratio to the S&P 500 Index.
And, as most of you are aware, we have shared today’s chart before. Our last update was in early February – you can read it here.
So far, what we’ve shared in the past, continues to play out in similar fashion to the 2000 pattern. Whether it’s a repeat or a fractal (rhyme) doesn’t matter.
A pattern is a pattern and this has been calling for caution since support broke. And selling in tech stocks appears to be picking up. Is a “waterfall” in tech stock playing out? Stay tuned!
Nasdaq Composite / S&P 500 Index Ratio Chart
Note that KimbleCharting is offering a 2 week Free trial to See It Market readers. Just send me an email to services@kimblechartingsolutions.com for details to get set up.
Twitter: @KimbleCharting
Any opinions expressed herein are solely those of the author, and do not in any way represent the views or opinions of any other person or entity.


