The main bank of stock market leadership has come from the technology sector.
Let’s face it, tech stocks have been market leaders for years and a core driver of our economy.
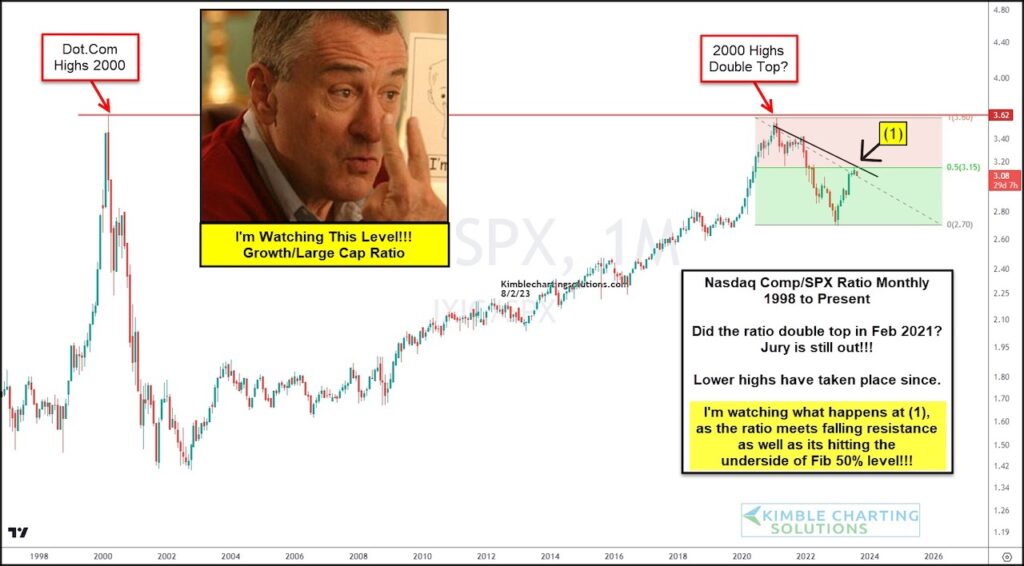
BUT the post-COVID Nasdaq performance versus the S&P 500 has not been great. The bright side of this? The Nasdaq is attempting to reassert its leadership in the marketplace. The downside? It could also turn back down again…
As you can see on today’s long-term “monthly” Nasdaq Composite vs S&P 500 Index price performance ratio, the technology index has out-performed for years until recently. The ratio is now testing its falling downtrend line and 50% Fibonacci level at (1).
I’m watching this level at (1) very closely, as it will either mean a continuation of near-term underperformance (bearish), or a breakout higher and a reassertion of market leadership (bullish).
Let’s just say that bulls do not want to see selling begin here. Stay tuned!
Nasdaq Composite vs S&P 500 Index Price Ratio “monthly” Chart
Note that KimbleCharting is offering a 2 week Free trial to See It Market readers. Just send me an email to services@kimblechartingsolutions.com for details to get set up.
Twitter: @KimbleCharting
Any opinions expressed herein are solely those of the author, and do not in any way represent the views or opinions of any other person or entity.

 Testing Important Price Support")
: Cup (and Maybe Handle) Watch")

