When there is bull market in tech stocks, there is likely to be leadership from the semiconductor sector.
In fact, one might argue that the Semiconductor Index (SOX) has been on fire (BULLISH) since the 2020 low.
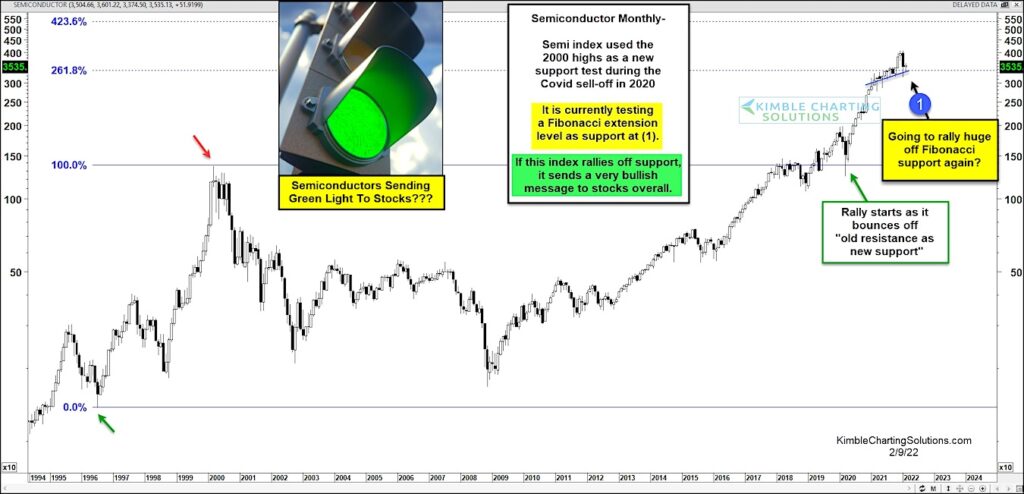
Today’s long-term “monthly” chart highlights this and more. Note that the 2020 COVID crash brought the Semiconductors down to a key old resistance, new support line (red/green arrows).
When that support held firm it ignited a sharp multi-month rally higher into and breaking out above the 261.8% Fibonacci extension level. It is currently testing this key Fibonacci level as support at (1) – i.e. trying to hold onto the breakout over it.
This is a big test for tech stock at (1). If the Semiconductor Index rallies from here, it would send a solid bullish message to tech and the broader market. Stay tuned!
Semiconductor Index Chart
Note that KimbleCharting is offering a 2 week Free trial to See It Market readers. Just send me an email to services@kimblechartingsolutions.com for details to get set up.
Twitter: @KimbleCharting
Any opinions expressed herein are solely those of the author, and do not in any way represent the views or opinions of any other person or entity.


