Since the 2000 tech bubble and crash, tech stocks have regained their leadership form. Especially large cap tech stocks.
Headlines have varied have varied in focus from the “4 horseman” to “FANG” and “FANGE”, but one thing remains: Large cap tech stocks have been the bull market leader.
So what about when large cap tech lags the market? Not so good.
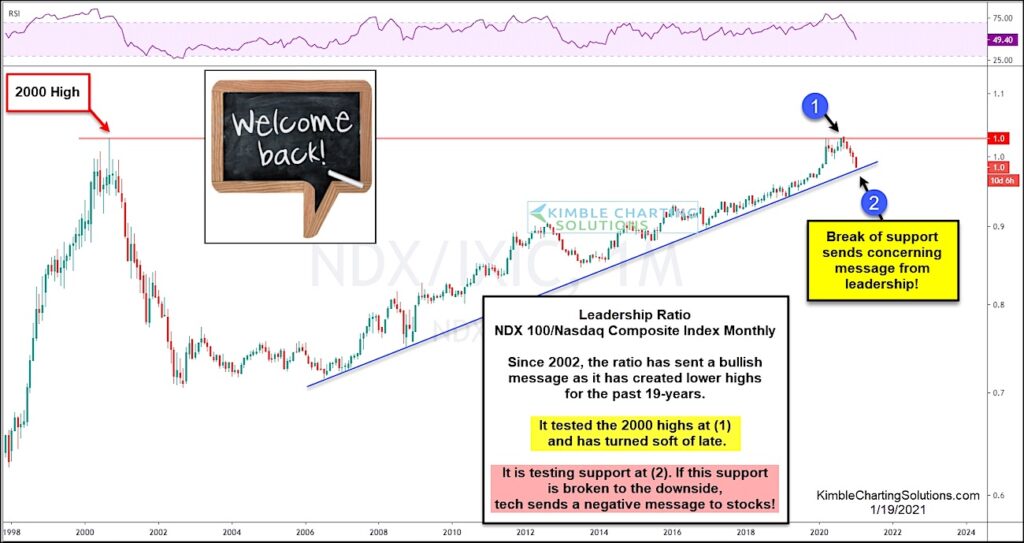
In today’s chart, we look at a “monthly” chart of the performance ratio of the Nasdaq 100 Index to the Nasdaq Composite. It’s basically a look at how large cap tech stocks perform against the broader tech stocks world.
As you can see, this ratio peaked out in 2000, bottomed in 2002, and has been in an up-trend ever since. That up-trend has been formed with higher lows, creating a trend line that has yet to be broken.
Are Tech Stocks About To Head Lower?
Last summer, large cap tech’s out-performance pushed this ratio back to its 2000 high at (1) before turning lower. That turn lower has turned into several months of under-performance and has the ratio testing its bullish trend line support at (2).
How large cap tech stocks fare here will be important. As a market leader, a breakdown in large cap tech stocks would be very bearish for bulls. Stay tuned!
NASDAQ 100 vs NASDAQ Composite Ratio “monthly” Chart
Note that KimbleCharting is offering a 2 week Free trial to See It Market readers. Just send me an email to services@kimblechartingsolutions.com for details to get set up.
Twitter: @KimbleCharting
Any opinions expressed herein are solely those of the author, and do not in any way represent the views or opinions of any other person or entity.

 Testing Important Price Support")
: Cup (and Maybe Handle) Watch")

