There are several indicators to watch when assessing risk across the financial markets, and today we discuss one of the more important ones.
Junk bonds.
When junk bonds are performing well and in demand, that is a sign of “risk-on”. But when they are under-performing, that is a sign of “risk-off”. And the latter applies to today’s marketplace.
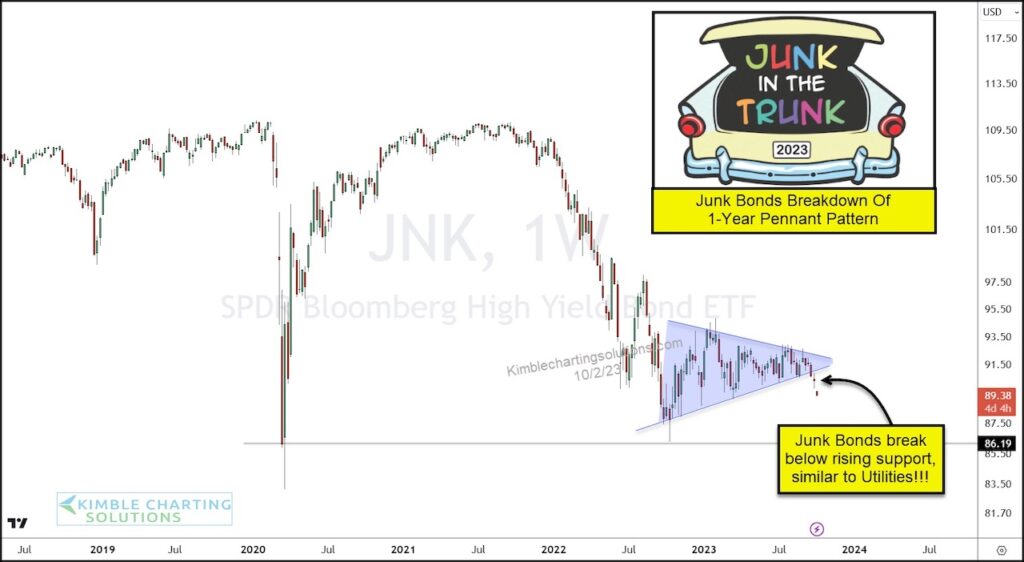
Below is a chart of the Junk Bonds ETF (JNK). As you can see, a year-long narrowing pennant pattern formed and appears to be breaking down
In the past, junk bond weakness has been followed by stock weakness….will it be different this time? Stay tuned!
Junk Bonds ETF (JNK) Chart
Note that KimbleCharting is offering a 2 week Free trial to See It Market readers. Just send me an email to services@kimblechartingsolutions.com for details to get set up.
Twitter: @KimbleCharting
Any opinions expressed herein are solely those of the author, and do not in any way represent the views or opinions of any other person or entity.
Editor’s Note (October 4, 2023 12:27pm central time): Author’s information at the bottom of the article was changed to reflect the correct author.


