Considering our national debt and the debts of companies and consumers, it’s obvious that the bond market is critical to our economy.
This is likely why the Investment Grade Bond ETF (LQD) started to sputter last year, well before the bear market in stocks this year.
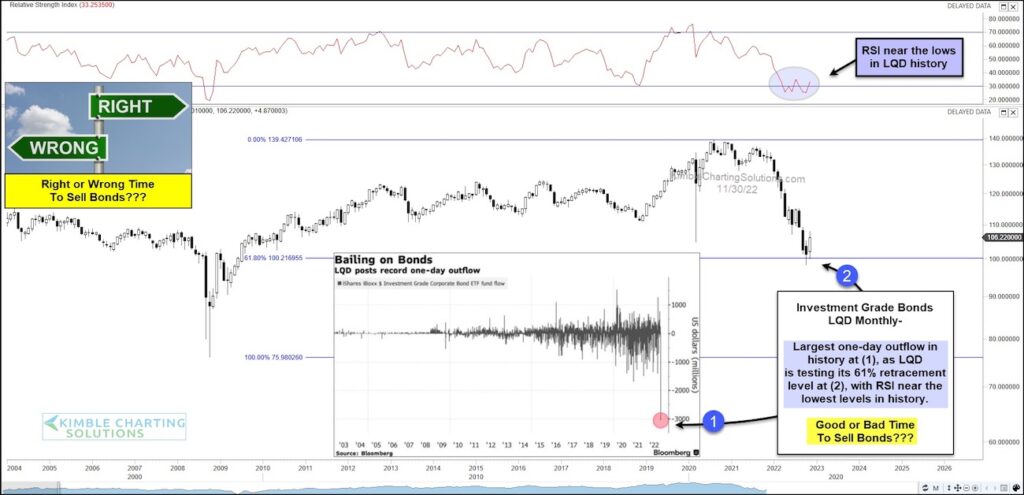
You can see the turn lower on today’s chart, a long-term “monthly” chart of LQD. This downturn also hinted at the economic slowdown we are seeing.
So, is it a good or bad time to sell bonds?
As November was coming to an end, the Investment Grade Bonds ETF (LQD) recorded its largest one-day outflows in its history at (1). Wow! Could this be a contrarian indicator of a bottom?
It’s worth noting that LQD recorded one of its lowest RSI (Relative Strength Index) readings in history and is turning higher after testing its 61% Fibonacci retracement level at (2).
Will these historic readings / indicators lead to a broader rally in investment grade corporate bonds? Stay tuned!
$LQD Investment Grade Bonds ETF “monthly” Chart
Note that KimbleCharting is offering a 2 week Free trial to See It Market readers. Just send me an email to services@kimblechartingsolutions.com for details to get set up.
Twitter: @KimbleCharting
Any opinions expressed herein are solely those of the author, and do not in any way represent the views or opinions of any other person or entity.


