The past few years have seen extreme volatility in the bond market, which equates to similar volatility in interest rates.
And it all started with the onset of coronavirus. The initial panic decline in bond yields (interest rates) was followed by a surge that lasted several quarters. And now, once again, we may be seeing another giant reversal.
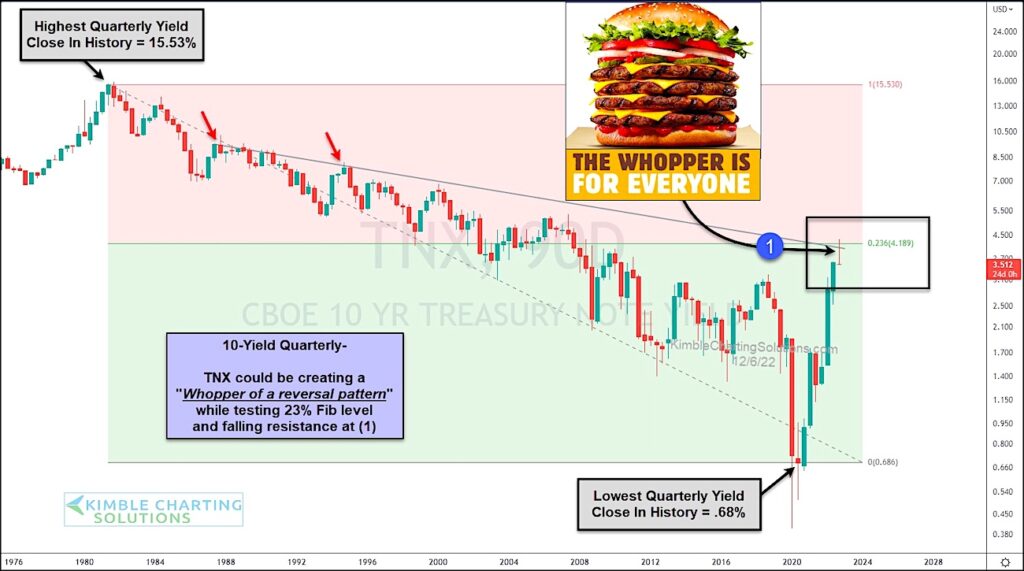
Below is a long-term “quarterly” chart of the 10-year treasury bond yield. You can see how yields recorded the lowest quarterly close at .68% before staging a huge rally.
This quarter, however, bond yields hit dual resistance at the falling trend line and 23% Fibonacci level at (1) and reversed lower.
But this wasn’t any old reversal… The 10-year bond yield could be creating the largest bearish reversal pattern in yield history at (1).
Higher interest rates have rattled the financial markets hard so a reversal lower is welcome news for consumers and stock market bulls. Stay tuned!
10-Year US Treasury Bond Yield “quarterly” Chart
Note that KimbleCharting is offering a 2 week Free trial to See It Market readers. Just send me an email to services@kimblechartingsolutions.com for details to get set up.
Twitter: @KimbleCharting
Any opinions expressed herein are solely those of the author, and do not in any way represent the views or opinions of any other person or entity.
12/7/22: Editor deleted duplicate word.

: Worrisome to Broader Market?")
