Equity investors like it when the markets are in “risk-on” mode.
What’s that mean? Well, it means when investors are more willing to take risks. When this happens, the stock market heads higher… and with a stronger trend.
A few areas that indicate “risk-on” are small and micro cap stocks, junk bonds, and growth stocks (among others). Today we look at growth stocks and compare them to the counterpart value stocks.
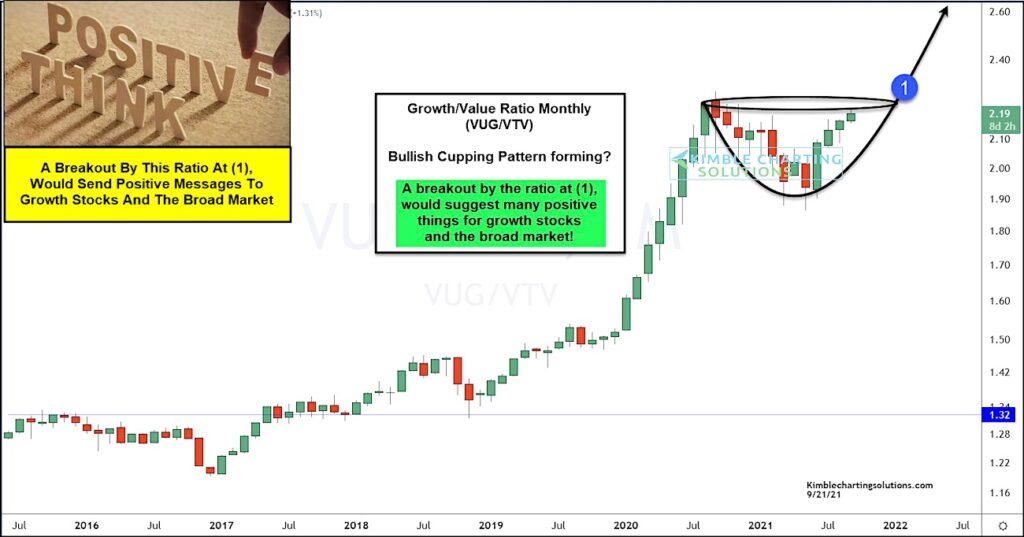
Below is a “monthly” ratio performance ratio chart of the Vanguard growth stocks ETF (VUG) to Vanguard value stocks ETF (VTV). Here you can see where (in time) growth stocks have out-performed value stocks. The steepest move higher came over 8 months in 2020, as the stock market raged back from the coronavirus crash. Since then, the growth/value stocks ratio has consolidated in a potentially bullish “cup” formation.
A breakout by this ratio at (1) would send a positive message to the broad market! Stay tuned!
$VUG Growth / $VTV Value “Monthly” Performance Ratio Chart
Note that KimbleCharting is offering a 2 week Free trial to See It Market readers. Just send me an email to services@kimblechartingsolutions.com for details to get set up.
Twitter: @KimbleCharting
Any opinions expressed herein are solely those of the author, and do not in any way represent the views or opinions of any other person or entity.

: Creating Bullish Divergence?")

: Creating Bullish Divergence?")


