The energy sector is showing signs of life again? Should investors trust this move?
We’ll let the price action speak for itself, but it investors should get a signal soon.
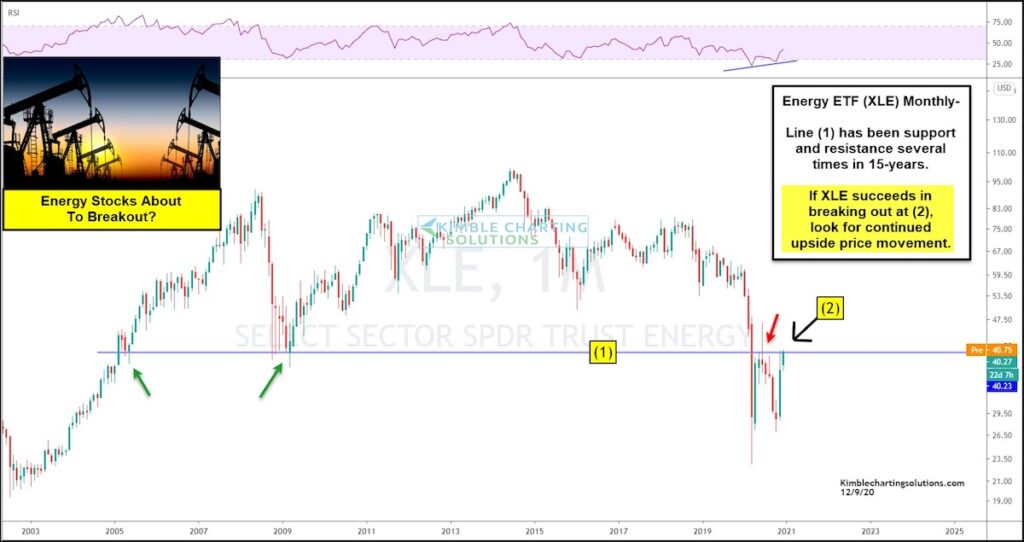
Today’s chart take a long-term “monthly” view of the Energy Sector ETF (XLE) and highlights the current downtrend… as well as the recent rally.
The early year spike lows (coronavirus crash) were successfully retested this summer spurring a rally for XLE and energy stocks. XLE is now closing in on an important 15-year price support/resistance level at (1). The current rally is being fueled by higher crude oil prices (now nearing $50) and a broader commodities rally. Looking at the chart, this looks like a big test for the out of favor Energy Sector (XLE).
If XLE succeeds in breaking out above (2), look for continued upside price movement.
To answer the question, are energy stocks back? …Stay tuned!
Note that KimbleCharting is offering a 2 week Free trial to See It Market readers. Just send me an email to services@kimblechartingsolutions.com for details to get set up.
Twitter: @KimbleCharting
Any opinions expressed herein are solely those of the author, and do not in any way represent the views or opinions of any other person or entity.


